Quality Dashboard
The data quality dashboard can be set up in two ways: you can import it directly in your workspace from the GitHub repository, or it will be automatically deployed when you install DQX using the Databricks CLI. For more details on the installation process, see the Installation Guide.
The dashboard makes it easy to monitor and track data quality issues across all tables, with the flexibility to customize it to your specific needs.
The dashboard is not scheduled to refresh automatically by default, minimizing concerns regarding associated cluster costs. When you open a dashboard, refresh it manually to view the latest data. However, as needed, you can configure the dashboard to refresh periodically.
Dashboard Tabs
The dashboard consists of three tabs, each designed for different monitoring scenarios:
1. Data Quality Summary
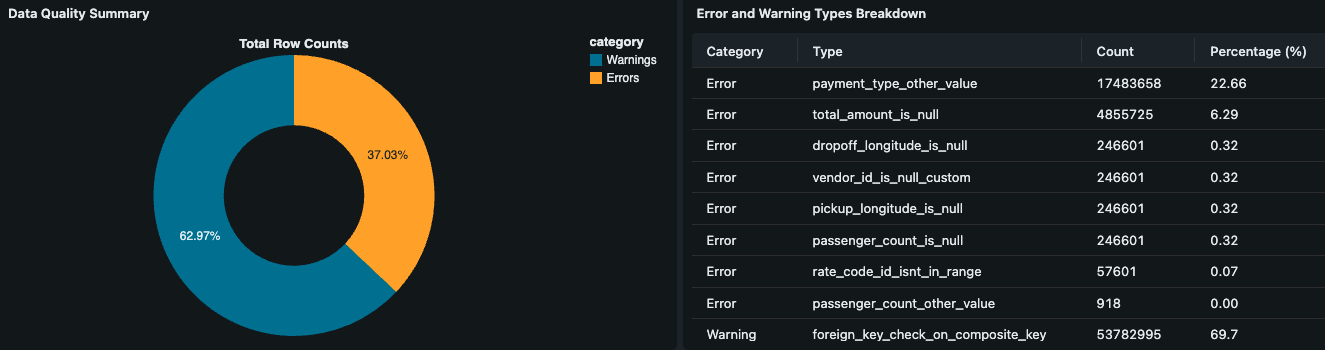
The Data Quality Summary tab provides an overview of data quality metrics using the summary metrics table (if configured). This tab displays aggregated quality statistics across all monitored tables, giving you a high-level view of your data quality status. For information on how to configure summary metrics, see the Summary Metrics Guide.
2. Data Quality by Table (Time Series)
The Data Quality by Table (Time Series) tab allows you to get detailed information at the check-level for individual tables within a specific time frame. This tab uses date or timestamp columns to filter and analyze data quality issues over time, enabling you to track quality trends and identify when issues occurred.
3. Data Quality by Table (Full Snapshot)
The Data Quality by Table (Full Snapshot) tab provides check-level information for individual tables using the entire table without time-based filtering. This tab is useful for comprehensive analysis of all data quality issues in a table, regardless of when they occurred.
Dashboard Configuration
The Invalid Data Table Name parameter is automatically filtered to display only tables that have _errors or _warnings reporting columns. This ensures that only tables with data quality issues are shown in the dashboard, making it easier to focus on tables that require attention.
If your tables use different column names for error and warning reporting, you can configure the reporting column names in the dashboard parameters. The default reporting column names are _errors and _warnings, but these can be customized if your tables use different naming conventions.
If quarantining was not used during data quality checking (i.e., there is only a single output table with warnings and errors, and no split between valid and invalid data), you need to provide the same table for both the Curated Data Table Name (good data) and Invalid Data Table Name (bad data) parameters in the dashboard.
How to locate the dashboard:
- CLI
- Python
You can locate the dashboard by using Databricks workspace UI directly or by using the following Databricks CLI command:
databricks labs dqx open-dashboards
After executing the command:
- Locate and click on a dashboard file in the workspace UI.
- Open the dashboard and click
Refreshto load the latest data.
You can locate the dashboard using Databricks workspace UI directly or use the following code:
from databricks.labs.dqx.contexts.workspace import WorkspaceContext

ctx = WorkspaceContext(WorkspaceClient())
dashboards_folder_link = f"{ctx.installation.workspace_link('')}dashboards/"
print(f"Open a dashboard from the following folder and refresh it:")
print(dashboards_folder_link)
Connecting a Genie Space
You can link a Databricks Genie Space to the DQX dashboard so that dashboard viewers can ask natural-language questions against the dashboard data — without leaving the dashboard.
Prerequisites
Before starting, confirm that:
- The Genie capability is enabled in your Databricks workspace.
- The Genie space you want to link already exists and has been shared with the right users or groups.
- Users who will interact with the linked Genie space have the appropriate Databricks access entitlement and at least
SELECTprivileges on the Unity Catalog data objects used by the space.
To link the Genie space:
- Open the DQX dashboard in Databricks in Edit Draft mode.
- In the right-hand panel, click Settings. You can also open settings from the kebab menu (⋮) and choose Settings.
- Open the General section.
- Make sure Enable Genie is turned on.
- Select Link existing Genie space.
- Paste the URL of the existing Genie space into the field provided.
- Publish or republish the dashboard so viewers can use the linked Genie experience.
To get the Genie space URL: open the Genie space, click Share, and use Copy link.
If no existing space is linked, Databricks automatically generates a new companion Genie space from the dashboard when it is published and Genie is enabled.
Questions asked through Genie are answered from the full dataset query results behind the dashboard, not only from what is currently visible in the charts. Sensitive rows or columns included in the dataset can be exposed through Genie even if they are not shown in a visualization.
Troubleshooting
Genie option is unavailable: Check whether Genie is enabled for the account and workspace.
Users can open the dashboard but not ask questions: Verify Databricks SQL or consumer access entitlement and confirm users have permission on the underlying Unity Catalog objects.
Wrong or overly broad answers: Review the Genie space configuration, attached data sources, and instructions. Genie can query beyond explicitly attached tables if permissions and context allow it.