Profiling and Quality Checks Generation
Data profiling can be run to profile input data and generate quality rule candidates with summary statistics.
The generated data quality rules (checks) candidates can be used as input for the quality checking as described here. In addition, the Lakeflow (DLT) generator can generate native Lakeflow Pipelines expectations.
You can run profiling and quality checks generation using the following approaches:
- DQX Studio (no-code UI): for a no-code experience, DQX Studio is the recommended option. It lets you profile tables and review and save the generated rule candidates from a browser, without writing code.
- Programmatic approach: you can use DQX classes to run the profiler and quality checks generator on DataFrames or tables, and save the generated checks to a storage.
- No-code approach (Profiler Workflow): you can run the profiler and quality checks generator on tables as a workflow if DQX is installed in the workspace as a tool. The workflow will save the generated checks to a file or table automatically.
See DQProfile Types for a complete list of profile types and associated DQX rules.
Data profiling is typically performed as a one-time action for the input dataset to discover the initial set of quality rule candidates. The check candidates should be manually reviewed before being applied to the data. This is not intended to be a continuously repeated or scheduled process, thereby also minimizing concerns regarding compute intensity and associated costs.
DQX offers AI-assisted generation of data quality rules based on user input in natural language. See more details in the AI-Assisted Data Quality Rules Generation section.
DQX also offers AI-assisted primary key detection to generate uniqueness rules. See more details in the AI-Assisted Primary Key Detection section.
Programmatic approach
You can use DQX classes to profile data and generate quality checks candidates programmatically. There are multiple storage options for saving the generated quality checks as described here.
Profiling a DataFrame
Data loaded as a DataFrame can be profiled using DQX classes to generate summary statistics and candidate data quality rules.
- Python
from databricks.labs.dqx.profiler.profiler import DQProfiler
from databricks.labs.dqx.profiler.generator import DQGenerator
from databricks.labs.dqx.profiler.dlt_generator import DQDltGenerator
from databricks.labs.dqx.config import WorkspaceFileChecksStorageConfig
from databricks.labs.dqx.engine import DQEngine
from databricks.sdk import WorkspaceClient

input_df = spark.read.table("catalog1.schema1.table1")

# profile input data
ws = WorkspaceClient()
profiler = DQProfiler(ws)
summary_stats, profiles = profiler.profile(input_df)

# generate DQX quality rules/checks
generator = DQGenerator(ws)
checks = generator.generate_dq_rules(profiles)  # with default level "error"

dq_engine = DQEngine(ws)

# save checks as YAML in arbitrary workspace location
dq_engine.save_checks(checks, config=WorkspaceFileChecksStorageConfig(location="/Shared/App1/checks.yml"))

# generate Lakeflow Pipeline (DLT) expectations
dlt_generator = DQDltGenerator(ws)

dlt_expectations = dlt_generator.generate_dlt_rules(profiles, language="SQL")
print(dlt_expectations)

dlt_expectations = dlt_generator.generate_dlt_rules(profiles, language="Python")
print(dlt_expectations)

dlt_expectations = dlt_generator.generate_dlt_rules(profiles, language="Python_Dict")
print(dlt_expectations)
The profiler samples 30% of the data (sample ratio = 0.3) and limits the input to 1000 records by default. These and other configuration options can be customized as detailed in the Profiling Options section.
Profiling a table
Profiling and quality checks generation can be run on individual tables.
- Python
from databricks.labs.dqx.profiler.profiler import DQProfiler
from databricks.sdk import WorkspaceClient
from databricks.labs.dqx.config import InputConfig

ws = WorkspaceClient()
profiler = DQProfiler(ws)

summary_stats, profiles = profiler.profile_table(
  input_config=InputConfig(location="catalog1.schema1.table1")
  columns=["col1", "col2", "col3"],  # specify columns to profile
)

print("Summary Statistics:", summary_stats)
print("Generated Profiles:", profiles)
Profiling multiple tables
The profiler can discover and profile multiple tables accessible via Unity Catalog. Tables can be passed explicitly as a list or be included/excluded using wildcard patterns (e.g. "catalog.schema.*").
- Python
from databricks.labs.dqx.profiler.profiler import DQProfiler
from databricks.sdk import WorkspaceClient

ws = WorkspaceClient()
profiler = DQProfiler(ws)

# Profile several tables by name
results = profiler.profile_tables_for_patterns(
  patterns=["main.data.table_001", "main.data.table_002"]
)

# Process results for each table
for table, (summary_stats, profiles) in results.items():
  print(f"Table: {table}")
  print(f"Table statistics: {summary_stats}")
  print(f"Generated profiles: {profiles}")

# Profile several tables by wildcard patterns
results = profiler.profile_tables_for_patterns(
  patterns=["main.*", "data.*"]
)

# Process results for each table
for table, (summary_stats, profiles) in results.items():
  print(f"Table: {table}")
  print(f"Table statistics: {summary_stats}")
  print(f"Generated profiles: {profiles}")

# Exclude tables matching specific patterns
results = profiler.profile_tables_for_patterns(
  patterns=["sys.*", "*_tmp"],
  exclude_matched=True
)

# Process results for each table
for table, (summary_stats, profiles) in results.items():
  print(f"Table: {table}")
  print(f"Table statistics: {summary_stats}")
  print(f"Generated profiles: {profiles}")

# Exclude tables matching specific patterns
results = profiler.profile_tables_for_patterns(
  patterns=["sys.*", "*_tmp"],
  exclude_patterns=["*_dq_output", "*_dq_quarantine"], # skip existing output tables using suffixes
)

# Process results for each table
for table, (summary_stats, profiles) in results.items():
  print(f"Table: {table}")
  print(f"Table statistics: {summary_stats}")
  print(f"Generated profiles: {profiles}")
Profiling and expectations generation for Lakeflow Pipelines
You can integrate DQX quality checking directly with Lakeflow Pipelines (formerly Delta Live Tables, DLT). You can also generate Lakeflow Pipelines expectation statements from profiler results.
- Python
from databricks.labs.dqx.profiler.dlt_generator import DQDltGenerator
from databricks.sdk import WorkspaceClient

# After profiling your data
ws = WorkspaceClient()
profiler = DQProfiler(ws)
summary_stats, profiles = profiler.profile(input_df)

# Generate Lakeflow Pipelines expectations
dlt_generator = DQDltGenerator(ws)

# Generate SQL expectations
sql_expectations = dlt_generator.generate_dlt_rules(profiles, language="SQL")
print("SQL Expectations:")
for expectation in sql_expectations:
    print(expectation)
# Output example:
# CONSTRAINT user_id_is_null EXPECT (user_id is not null)
# CONSTRAINT age_isnt_in_range EXPECT (age >= 18 and age <= 120)

# Generate SQL expectations with actions
sql_with_drop = dlt_generator.generate_dlt_rules(profiles, language="SQL", action="drop")
print("SQL Expectations with DROP action:")
for expectation in sql_with_drop:
    print(expectation)
# Output example:
# CONSTRAINT user_id_is_null EXPECT (user_id is not null) ON VIOLATION DROP ROW

# Generate Python expectations
python_expectations = dlt_generator.generate_dlt_rules(profiles, language="Python")
print("Python Expectations:")
print(python_expectations)
# Output example:
# @dlt.expect_all({
#   "user_id_is_null": "user_id is not null",
#   "age_isnt_in_range": "age >= 18 and age <= 120"
# })

# Generate Python dictionary format
dict_expectations = dlt_generator.generate_dlt_rules(profiles, language="Python_Dict")
print("Python Dictionary Expectations:")
print(dict_expectations)
# Output example:
# {
#   "user_id_is_null": "user_id is not null",
#   "age_isnt_in_range": "age >= 18 and age <= 120"
# }
No-code approach (Profiler Workflow)
You can run profiler workflow to profile tables and generate quality checks candidates. The profiler workflow saves the generated checks automatically in the checks location as defined in the configuration file.
You need to install DQX as a tool in the workspace to have the profiler workflow available (see installation guide). The workflow is not scheduled to run automatically by default, minimizing concerns regarding compute and associated costs. Profiling is typically done as a one-time action for the input dataset to discover the initial set of quality rule candidates.
You can run the profiler workflow from Databricks UI or by using Databricks CLI:
# Run for all run configs in the configuration file
databricks labs dqx profile

# Run for a specific run config in the configuration file
databricks labs dqx profile --run-config "default"

# Run for all tables/views matching wildcard patterns. Conventions:
# * Run config from configuration file is used as a template for all relevant fields except location
# * Input table location is derived from the patterns
# * For table-based checks location, checks are saved to the specified table
# * For file-based checks location, file in the path is replaced with <input_table>.yml. In addition, if the location is specified as a relative path, it is prefixed with the installation folder
# * By default, output and quarantine tables are excluded based on suffixes
# * Default for output table suffix is "_dq_output"
# * Default for quarantine table suffix is "_dq_quarantine"
databricks labs dqx profile --run-config "default" --patterns "main.product001.*;main.product002"

# Run for wildcard patterns and exclude patterns
databricks labs dqx profile --run-config "default" --patterns "main.product001.*;main.product002" --exclude-patterns "*_output;*_quarantine"
You can also provide --timeout-minutes option.
When running the profiler workflow using Databricks API or UI, you have the same execution options:
- By default, the workflow executes across all defined run configs within the configuration file.
- To execute the workflow for a specific run config, specify the
run_config_nameparameter during execution. - To execute the workflow for tables/views matching wildcard patterns, provide value for
run_config_nameandpatternsparameters during execution. The following parameters are supported for pattern based execution:patterns: Accepts a semicolon-delimited list of patterns, e.g., "catalog.schema1.*;catalog.schema2.table1".run_config_name: Specifies the run config to use as a template for all relevant settings, except location field ('input_config.location') which is derived from the patterns.- The output and quarantine table names are derived by appending the value of
output_table_suffixandquarantine_table_suffixjob parameters, respectively, to the input table name. - If the
checks_locationin the run config points to a table, the checks will be saved to that table. If thechecks_locationin the run config points to a file, file name is replaced with "<input_table>.yml". In addition, if the location is specified as a relative path, it is prefixed with the workspace installation folder. For example:- If "checks_location=catalog.schema.table", the location will be resolved to "catalog.schema.table" or "database.schema.table" in case of using Lakebase to store checks.
- If "checks_location=folder/checks.yml", the location will be resolved to "install_folder/folder/<input_table>.yml".
- If "checks_location=/App/checks.yml", the location will be resolved to "/App/<input_table>.yml".
- If "checks_location=/Volume/catalog/schema/folder/checks.yml", the location will be resolved to "/Volume/catalog/schema/folder/<input_table>.yml".
exclude_patterns: (optional) Accepts a semicolon-delimited list of patterns to exclude, e.g., "*_output;*_quarantine".- By default, the workflow skips output and quarantine tables automatically based on the
output_table_suffixandquarantine_table_suffixjob parameters. This prevents potential profiling of the output and quarantine tables generated by the quality checker workflow. To disable this behavior, clear the values ofoutput_table_suffixandquarantine_table_suffixin the job parameters. output_table_suffix: (optional) Suffix used for the output table names (default: "_dq_output").quarantine_table_suffix: (optional) Suffix used for to the quarantine table names (default: "_dq_quarantine").
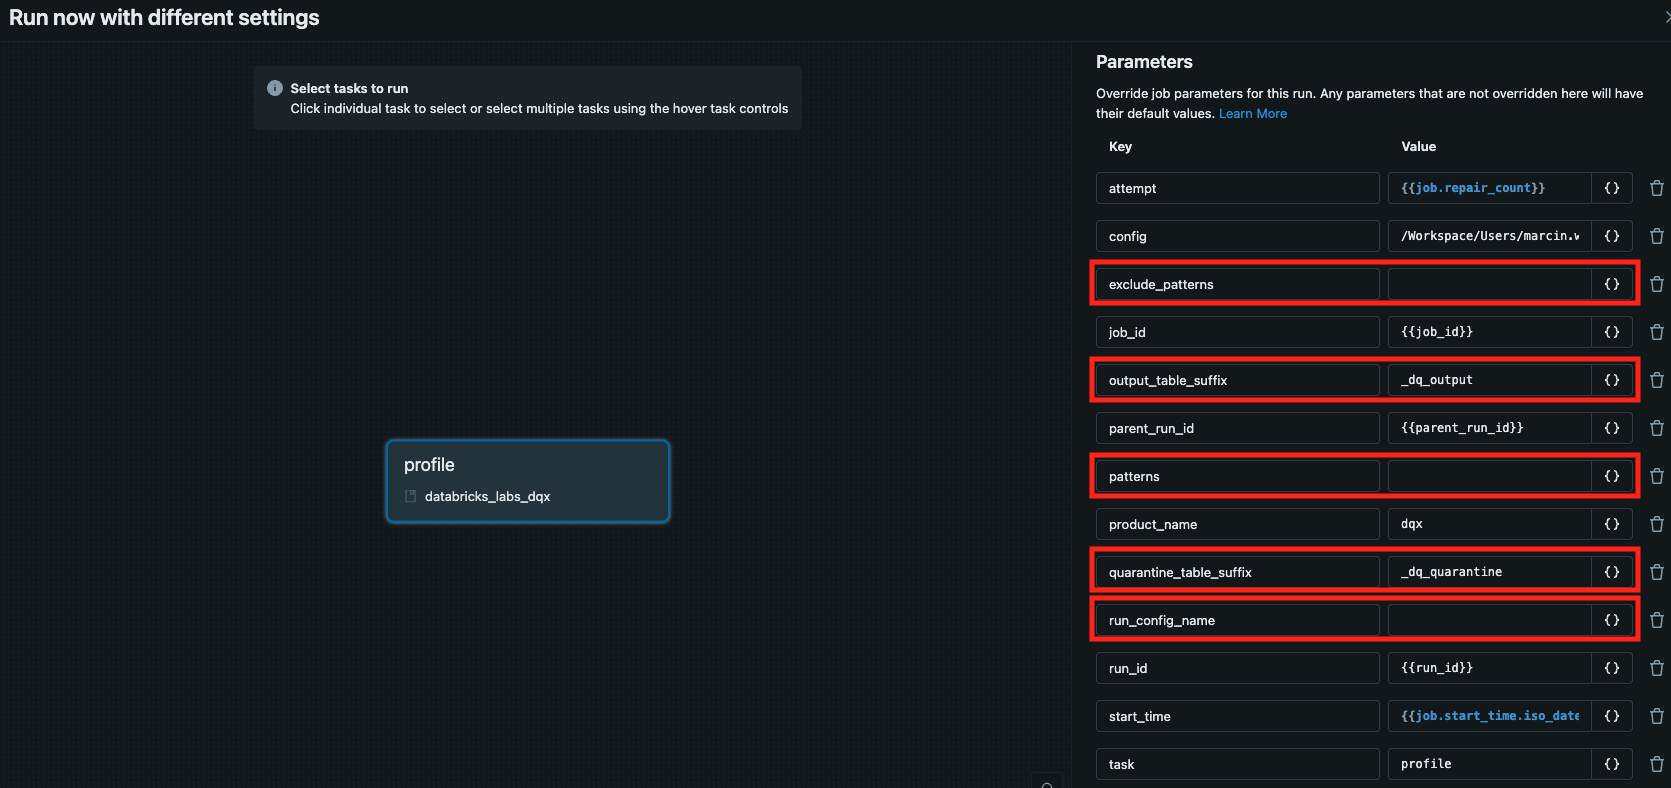
See the relevant params in red:
Execution logs from the profiler are printed in the console and saved in the installation folder. You can display the logs from the latest profiler workflow run by executing:
databricks labs dqx logs --workflow profiler
The generated quality rule candidates and summary statistics will be saved in the checks_location set in the run config of the configuration file.
You can open the configuration file (.dqx/config.yml) in the installation folder from Databricks UI or by executing the following Databricks CLI command:
databricks labs dqx open-remote-config
The following fields from the configuration file are used by the profiler workflow:
input_configconfiguration for the input data. 'location' is autogenerated when the workflow is executed for patterns.checks_location: location of the quality checks in storage. Autogenerated when the workflow is executed for patterns.profiler_config: configuration for the profiler containing:summary_stats_file: relative location within the installation folder of the summary statistics (default: 'profile_summary_stats.yml')sample_fraction: fraction of data to sample. Pass a single float for uniform sampling, or a{stratum: fraction}dict for per-stratum sampling (requiressample_by_column).sample_seed: seed for reproducible sampling.sample_by_column: optional column used to draw a stratified sample via Spark'sDataFrame.sampleBy. When set, the profiler samples over the distinct values of the column so every stratum is represented in the profile. Use a floatsample_fractionfor uniform sampling across all strata or a dictsample_fractionto control the sampling proportion per stratum.sample_by_values_limit: maximum number of distinctsample_by_columnvalues to collect whensample_fractionis a single float value (default: 1000). Values beyond the limit are excluded from the sample. Ignored whensample_fractionis a{stratum: fraction}dict.limit: maximum number of records to analyze.filter: filter for the input data as a string SQL expressioncriticality: default criticality for generated rules, eithererrororwarn(default:error).
checks_user_requirements: (optional) user input for AI-assisted rule generation. Only supported ifserverless_clustersis enabled.llm_config: (optional) configuration for the llm-assisted featuresserverless_clusters: whether to use serverless clusters for running the workflow (default: 'true'). Using serverless clusters is recommended as it allows for automated cluster management and scaling.profiler_spark_conf: (optional) spark configuration to use for the profiler workflow, only applicable ifserverless_clustersis set to 'false'.profiler_override_clusters: (optional) cluster configuration to use for profiler workflow, only applicable ifserverless_clustersis set to 'false'.profiler_max_parallelism: (optional) max parallelism for profiling multiple tables (default: 4)
Example of the configuration file (relevant fields only):
  serverless_clusters: true   # default is true, set to false to use standard clusters
  profiler_max_parallelism: 4 # max parallelism for profiling multiple tables
  llm_config:                 # configuration for the llm-assisted features
    model:
      model_name: "databricks/databricks-claude-sonnet-4-5"
      api_key: xxx    # optional API key for the model as secret in the format: secret_scope/secret_key. Not required by foundational models
      api_base: xxx   # optional API base for the model as secret in the format: secret_scope/secret_key. Not required by foundational models
  run_configs:
  - name: default
    checks_location: catalog.table.checks  # can be a table or file
    input_config:
      format: delta
      location: /databricks-datasets/delta-sharing/samples/nyctaxi_2019
      is_streaming: false # set to true if wanting to run it using streaming
    profiler_config:
      limit: 1000
      sample_fraction: 0.3
      summary_stats_file: profile_summary_stats.yml
      filter: "maintenance_type = 'preventive'"
      criticality: error  # default criticality for generated rules ('error' or 'warn')
      llm_primary_key_detection: false
    checks_user_requirements: "business rules description"  # optional user input for the llm-assisted features
Profiling options
The profiler supports extensive configuration options to customize the profiling behavior.
Profiling options for a single table
- Python
- Workflows
For code-level integration you can use options parameter to pass a dictionary with custom options when profiling a DataFrame or table.
from databricks.labs.dqx.profiler.profiler import DQProfiler
from databricks.sdk import WorkspaceClient
from databricks.labs.dqx.config import InputConfig

# Custom profiling options
custom_options = {
  # Sampling options
  "sample_fraction": 0.2,       # Sample 20% of the data
  "sample_seed": 42,            # Seed for reproducible sampling
  "limit": 2000,                # Limit to 2000 records after sampling

  # Outlier detection options
  "remove_outliers": True,      # Enable outlier detection for min/max rules
  "outlier_columns": ["price", "age"],  # Only detect outliers in specific columns
  "num_sigmas": 2.5,            # Use 2.5 standard deviations for outlier detection

  # Null value handling
  "max_null_ratio": 0.05,       # Generate is_not_null rule if <5% nulls

  # String handling
  "trim_strings": True,         # Trim whitespace from strings before analysis
  "max_empty_ratio": 0.02,      # Generate is_not_null_or_empty or is_not_empty rule if <2% empty strings

  # Distinct value analysis
  "distinct_ratio": 0.01,       # Generate is_in rule if <1% distinct values
  "max_in_count": 20,           # Maximum items in is_in rule list

  # Value rounding
  "round": True,                # Round min/max values for cleaner rules

  # Filter Options
  "filter": None,               # No filter (SQL expression)

  "llm_primary_key_detection": True,  # Detect PKs and generate uniqueness rule if found
}

ws = WorkspaceClient()
profiler = DQProfiler(ws)

# Apply custom options for profiling a DataFrame
summary_stats, profiles = profiler.profile(input_df, options=custom_options)

# Apply custom options for profiling a table
summary_stats, profiles = profiler.profile_table(
  input_config=InputConfig(location="catalog1.schema1.table1"),
  columns=["col1", "col2", "col3"],
  options=custom_options
)
For the profiler workflow, you can set profiling options for each run config in the configuration file using the following fields:
profiler_config: configuration for the profiler containing:summary_stats_file: relative location within the installation folder of the summary statistics (default: 'profile_summary_stats.yml')sample_fraction: fraction of data to sample. Pass a single float for uniform sampling, or a{stratum: fraction}dict for per-stratum sampling (requiressample_by_column).sample_seed: seed for reproducible sampling.sample_by_column: optional column to drive a stratified sample via Spark'sDataFrame.sampleBy. Pair with a floatsample_fractionfor uniform per-stratum sampling or a dictsample_fractionto override per stratum.sample_by_values_limit: maximum number of distinctsample_by_columnvalues to collect whensample_fractionis a single float value (default: 1000). Values beyond the limit are excluded from the sample. Ignored whensample_fractionis a{stratum: fraction}dict.limit: maximum number of records to analyze.filter: string SQL expression to filter the input datacriticality: default criticality for generated rules, eithererrororwarn(default:error).
You can open the configuration file to check available run configs and adjust the settings if needed:
databricks labs dqx open-remote-config
Example:
run_configs:
- name: default
  profiler_config:
    sample_fraction: 0.3 # Fraction of data to sample (30%)
    limit: 1000          # Maximum number of records to analyze
    sample_seed: 42      # Seed for reproducible results
    criticality: error   # default criticality for generated rules ('error' or 'warn')
    llm_primary_key_detection: false  # whether to use llm-assisted pk detection to generate uniqueness check
  ...
More detailed options such as 'num_sigmas' are not configurable when using profiler workflow. They are only available for programmatic integration.
Profiling options for multiple tables
When profiling multiple tables, you can pass a list of dictionaries to apply different options to each one. Wildcard patterns are supported, allowing you to match table names and apply specific options based on those patterns.
- Python
from databricks.labs.dqx.profiler.profiler import DQProfiler
from databricks.sdk import WorkspaceClient

ws = WorkspaceClient()
profiler = DQProfiler(ws)

tables = [
  "dqx.bronze.table_001",
  "dqx.silver.table_001",
  "dqx.silver.table_002",
]

# Custom options with wildcard patterns
custom_table_options = [
  {
    "table": "*",  # matches all tables by pattern
    "options": {"sample_fraction": 0.5}
  },
  {
    "table": "dqx.silver.*",  # matches tables in the 'dqx.silver' schema by pattern
    "options": {"num_sigmas": 5}
  },
  {
    "table": "dqx.silver.table_*",  # matches tables in 'dqx.silver' schema and having 'table_' prefix
    "options": {"num_sigmas": 5}
  },
  {
    "table": "dqx.silver.table_002",  # matches a specific table, overrides generic option
    "options": {"sample_fraction": 0.1}
  },
]

# Profile multiple tables using custom options
results = profiler.profile_tables_for_patterns(patterns=tables, options=custom_table_options)

# Profile multiple tables by wildcard patterns using custom options
results = profiler.profile_tables_for_patterns(
  patterns=["dqx.*"],
  options=custom_table_options
)
Understanding summary statistics and profiles
To ensure efficiency, summary statistics are computed on a sampled subset of your data, not the entire dataset. By default, the profiler proceeds as follows:
- It samples the rows of the dataset you provide by using Spark’s
DataFrame.sample(defaultsample_fraction = 0.3), which is probabilistic, hence the sampled row count is not guaranteed to be exact; the number may be slightly higher or lower. No filters are applied by default. - A limit is applied to the sampled rows (default
limit = 1000). - Statistics are computed on this final sampled-and-limited DataFrame.
These are defaults that can be customized programmatically as detailed in the Profiling Options section, or via profiler_config in the configuration file if DQX is installed as a tool.
Rule of thumb: count ≈ min(limit, sample_fraction × total_rows).
Summary Statistics Reference
| Field | Meaning | Notes |
|---|---|---|
count | Rows actually profiled (after sampling and limit) | ≈ min(limit, sample_fraction × total_rows) |
mean | Arithmetic average of non-null numeric values | N/A for non-numeric |
stddev | Sample standard deviation of non-null numeric values | N/A for non-numeric |
min | Smallest non-null value | String = lexicographic; Date/Timestamp = earliest; Numeric = minimum |
25 / 50 / 75 | Approximate 25th/50th/75th percentiles of non-null numeric values | Uses Spark approximate quantiles |
max | Largest non-null value | String = lexicographic; Date/Timestamp = latest; Numeric = maximum |
count_non_null | Number of non-null entries within the profiled rows | |
count_null | Number of null entries within the profiled rows | count_non_null + count_null = count |
Data Drift Detection
When you profile the same data repeatedly over time, the profiler's summary statistics let you detect data drift — shifts in the statistical distribution of your data. This matters for profiling because DQX derives quality-rule candidates from these statistics (e.g. min/max ranges, is_in allowed values, null-ratio thresholds): when the data drifts, rules generated from an earlier profile go stale and start producing false positives or stop catching real issues. Treat a profile captured at a known-good point in time as a baseline, compare later profiles against it, and regenerate the rules when the baseline has moved.
Metrics to compare against a baseline
profiler.profile(...) returns a summary_stats dictionary keyed by column name (see the Summary Statistics Reference above). Watch these per-column metrics for significant deviations from your baseline:
- Numeric columns: shifts in
meanorstddev, movement of themin/maxboundaries, or changes in the25/50/75percentiles. - Categorical columns: changes in
count_distinct, or changes to the allowed-value set inferred by the profiler'sis_incheck. - Completeness: a rise in
count_nullrelative tocount(completeness =count_non_null / count) signals an influx of NULLs.
Example: compare a profile against a saved baseline
from databricks.sdk import WorkspaceClient
from databricks.labs.dqx.profiler.profiler import DQProfiler

profiler = DQProfiler(WorkspaceClient())

# Flag a column when its mean shifts by more than this fraction of the baseline (20% here). Tune to taste.
mean_drift_threshold = 0.2

# Baseline captured earlier — persist summary_stats however you prefer (e.g. as a Delta table or JSON)
baseline_stats, _ = profiler.profile(reference_df)

# Current run
current_stats, _ = profiler.profile(current_df)

for column, baseline in baseline_stats.items():
    current = current_stats.get(column, {})
    base_mean, cur_mean = baseline.get("mean"), current.get("mean")
    if base_mean and cur_mean and abs(cur_mean - base_mean) / abs(base_mean) > mean_drift_threshold:
        print(f"Drift in '{column}': mean {base_mean} -> {cur_mean}")
By saving profile results periodically, you can build a historical ledger and trigger alerts when these markers drift beyond acceptable thresholds.
The approach above is a lightweight, manual comparison suited to profiling and rule-candidate generation. For automated, scored drift detection against a trained baseline, DQX's row anomaly detection already ships a drift detector: it compares each column against the model's training statistics using a z-score / standard-deviation-change score and flags drift past a configurable sigma threshold (default 3.0). If you need alertable drift rather than manual inspection, see the Row Anomaly Detection guide.
Performance considerations
When profiling large datasets, use sampling and limits for best performance.
- Python
- Workflows
# For large datasets, use aggressive sampling
large_dataset_opts = {
  "sample_fraction": 0.01, # Sample only 1% for very large datasets
  "limit": 10000,          # Increase limit for better statistical accuracy
  "sample_seed": 42,       # Use consistent seed for reproducible results
}

# For medium datasets, use moderate sampling
medium_dataset_opts = {
  "sample_fraction": 0.1,  # Sample 10%
  "limit": 5000,           # Reasonable limit
}

# For small datasets, disable sampling
small_dataset_opts = {
  "sample_fraction": None, # Use all data
  "limit": None,           # No limit
}
Use the following configuration in the configuration file to configure the profiler workflow:
For large datasets, use aggressive sampling:
profiler_config:
  sample_fraction: 0.01  # Sample only 1% for very large datasets
  limit: 10000           # Increase limit for better statistical accuracy
  sample_seed: 42        # Use consistent seed for reproducible results
For medium datasets, use moderate sampling:
profiler_config:
  sample_fraction: 0.1   # Sample 10%
  limit: 5000            # Reasonable limit
For small datasets, disable sampling:
profiler_config:
  sample_fraction: null  # Use all data
  limit: null            # No limit
Stratified sampling by column
By default, the profiler uses Spark's DataFrame.sample to get a uniform random sample over the whole dataset. For skewed or imbalanced data, this can under-represent (or miss entirely) rare strata of the dataset.
Set a sample_by_column to draw a stratified sample using Spark's DataFrame.sampleBy. The profiler samples each distinct value of the sample_by_column independently so every stratum contributes to the resulting profile. This is useful for ensuring rare categories are represented, comparing groups fairly, and profiling class-imbalanced datasets (e.g. over-sampling fraud or defect labels). Use the sample_fraction to control how much to sample from each stratum:
- Use a single float value to sample the same fraction across all strata.
- Use a dictionary of key-value pairs (e.g.
{stratum: fraction}) to control the sample fraction for each stratum. Strata that are not listed in the dictionary are excluded from the sample entirely (they are assigned a fraction of0), so include every stratum you want represented.
When sample_fraction is a single float value, the profiler collects distinct values of sample_by_column to build per-stratum sampling fractions. For high-cardinality columns this lookup can be expensive and is capped by sample_by_values_limit (default 1000). Rows whose sample_by_column value falls outside the collected set are excluded from the sample. Increase sample_by_values_limit to cover more strata, or pass a {stratum: fraction} dictionary to target specific strata explicitly (the limit does not apply to dictionaries).
Combining either limit with sample_by_column may filter out values and lead to underrepresentation of some strata. Raise these limits to cover more data, or pass a {stratum: fraction} dictionary to target specific strata explicitly (sample_by_values_limit does not apply to dictionaries).
Programmatic example
- Python
- Workflows
from databricks.labs.dqx.profiler.profiler import DQProfiler
from databricks.labs.dqx.config import InputConfig
from databricks.sdk import WorkspaceClient

ws = WorkspaceClient()
profiler = DQProfiler(ws)

# Uniform stratified sampling - apply sample_fraction to every distinct region
uniform_stratified_opts = {
  "sample_by_column": "region",
  "sample_fraction": 0.2,
  "sample_seed": 42,
}

# Per-stratum stratified sampling - over-sample the minority class
fraud_stratified_opts = {
  "sample_by_column": "label",
  "sample_fraction": {"fraud": 1.0, "not_fraud": 0.05},
  "sample_seed": 42,
}

# Time-based stratified sampling - cover every event_date in the profile
time_stratified_opts = {
  "sample_by_column": "event_date",
  "sample_fraction": 0.1,
  "sample_seed": 42,
}

summary_stats, profiles = profiler.profile_table(
  input_config=InputConfig(location="catalog.schema.transactions"),
  options=fraud_stratified_opts,
)
Set sample_by_column on profiler_config in the configuration file. sample_fraction may be a single float (applied to all strata) or a {stratum: fraction} mapping:
run_configs:
- name: default
  profiler_config:
    sample_by_column: region        # Stratify the sample by the region column
    sample_fraction: 0.2            # Applied to every distinct region
    sample_seed: 42
- name: fraud
  profiler_config:
    sample_by_column: label
    sample_fraction:                # Per-stratum mapping for label
      fraud: 1.0
      not_fraud: 0.05
    sample_seed: 42
sample_by_column and sample_fraction work together. When sample_by_column is set, a float sample_fraction is applied uniformly across all strata. A sample_fraction dictionary overrides the sampling fraction per stratum. When sample_by_column is not set, sample_fraction must be a float.
Summary statistics from limited samples may not reflect the characteristics of the overall dataset. Balance the sampling rate and limits with your desired profile accuracy. Manually review and tune rules generated from profiles on sample data to ensure correctness.