AdvancedTopics
Quick Reference
- Externalize Optimize & Z-Order
- Interacting With Overwatch and its State
- Optimizing Overwatch
- Maximizing First Run Potential
- Cluster Logs Ingest Details
- Joining With Slow Changing Dimensions (SCD)
Optimizing Overwatch
Expectation Check Note that Overwatch analyzes nearly all aspects of the Workspace and manages its own pipeline among many other tasks. This results in 1000s of spark job executions and as such, the Overwatch job will take some time to run. For small/medium workspaces, 20-40 minutes should be expected for each run. Larger workspaces can take longer, depending on the size of the cluster, the Overwatch configuration, and the workspace.
The optimization tactics discussed below are aimed at the “large workspace”; however, many can be applied to small / medium workspaces.
Large Workspace is generally defined “large” due to one or more of the following factors
- 250+ clusters created / day – common with external orchestrators such as airflow, when pools are heavily used, and many other reasons
- All clusters logging and 5000+ compute hours / day
Optimization Limitations (Bronze)
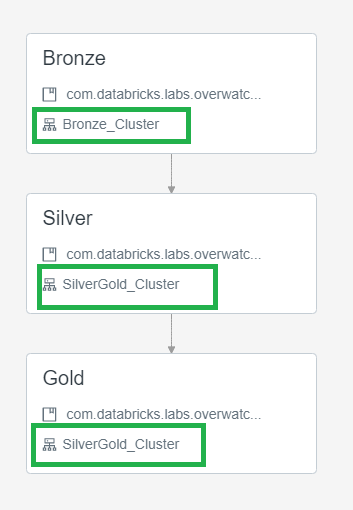
Note that there are two modules that simply cannot be linearly parallelized for reasons beyond the scope of this write-up. These limiting factors are only present in Bronze and thus one optimization is to utilize one cluster spec for bronze and another for silver/gold. To do this, utilize Databricks’ multi-task jobs feature to run into three steps and specify two cluster. To split the Overwatch Pipeline into bronze/silver/gold steps refer to the jar or notebook deployment method, as pertintent
- Bronze - small static (no autoscaling) cluster to trickle load slow modules
- Silver/Gold - slightly larger (autoscaling enabled as needed) - cluster to blaze through the modules as silver and gold modules are nearly linearly scalable. Overwatch developers will continue to strive for linear scalability in silver/gold.
Below is a screenshot illustrating the job definition when broken apart into a multi-task job.
Utilize External Optimize
Externalizing the optimize and z-order functions is critical for reducing daily Overwatch runtimes and increasing efficiency of the optimize and z-order functions. Optimize & z-order are more efficient the larger the dataset and the larger the number of partitions to be optimized. Furthermore, optimize functions are very parallelizable and thus should be run on a larger, autoscaling cluster. Lastly, by externalizing the optimize functions, this task only need be carried out on a single workspace per Overwatch output target (i.e. storage prefix target).
Additional Optimization Considerations
- As of 0.7.0 Use DBR 11.3 LTS
- Photon can significantly improve runtimes. Mileage will vary by customer depending on data sizes and skews of certain modules, so feel free to turn it on and use Overwatch to determine whether Photon is the right answer for your needs.
- As of 0.6.1 disable Photon
- Photon will be the focus of optimization in DBR 11.xLTS+
- 0.6.1+ Use DBR 10.4 LTS
- < 0.6.1 Use DBR 9.1 LTS
- This is critical as there are some regressions in 10.4LTS that have been handled in Overwatch 0.6.1 but not in previous versions
- (Azure) Follow recommendations for Event Hub. If using less than 32 partitions, increase this immediately.
- Ensure direct networking routes are used between storage and compute and that they are in the same region
- Overwatch target can be in separate region for multi-region architectures but sources should be co-located with compute.
Using External Metastores
If you’re using an external metastore for your workspaces, pay close attention to the Database Paths configured in the DataTarget. Notice that the workspaceID has been removed for the external metastore in the db paths. This is because when using internal metastores and creating databases in multiple workspaces you are actually creating different instances of databases with the same name; conversely, when you use an external metastore, the database truly is the same and will already exist in subsequent workspaces. This is why we remove the workspaceID from the path so that the one instance of the database truly only has one path, not one per workspace.
// DEFAULT
private val dataTarget = DataTarget(
  Some(etlDB), Some(s"${storagePrefix}/${workspaceID}/${etlDB}.db"), Some(s"${storagePrefix}/global_share"),
  Some(consumerDB), Some(s"${storagePrefix}/${workspaceID}/${consumerDB}.db")
)

// EXTERNAL METASTORE
private val dataTarget = DataTarget(
  Some(etlDB), Some(s"${storagePrefix}/${etlDB}.db"), Some(s"${storagePrefix}/global_share"),
  Some(consumerDB), Some(s"${storagePrefix}/${consumerDB}.db")
)
Externalize Optimize & Z-Order (as of 0.6.0)
The Overwatch pipeline has always included the Optimize & Z-Order functions. By default all targets are set to be optimized once per week which resulted in very different runtimes once per week. As of 0.6.0, this can be removed from the Overwatch Pipeline (i.e. externalized). Reasons to externalize include:
- Lower job runtime variability and/or improve consistency to hit SLAs
- Utilize a more efficient cluster type/size for the optimize job
- Optimize & Zorder are extremely efficient but do heavily depend on local storage; thus Storage Optimized compute
nodes are highly recommended for this type of workload.
- Azure: Standard_L*s series
- AWS: i3.*xLarge
- Optimize & Zorder are extremely efficient but do heavily depend on local storage; thus Storage Optimized compute
nodes are highly recommended for this type of workload.
- Allow a single job to efficiently optimize Overwatch for all workspaces
- Note that the scope of “all workspaces” above is within the scope of a data target. All workspaces that send data to the same dataset can be optimized from a single workspace.
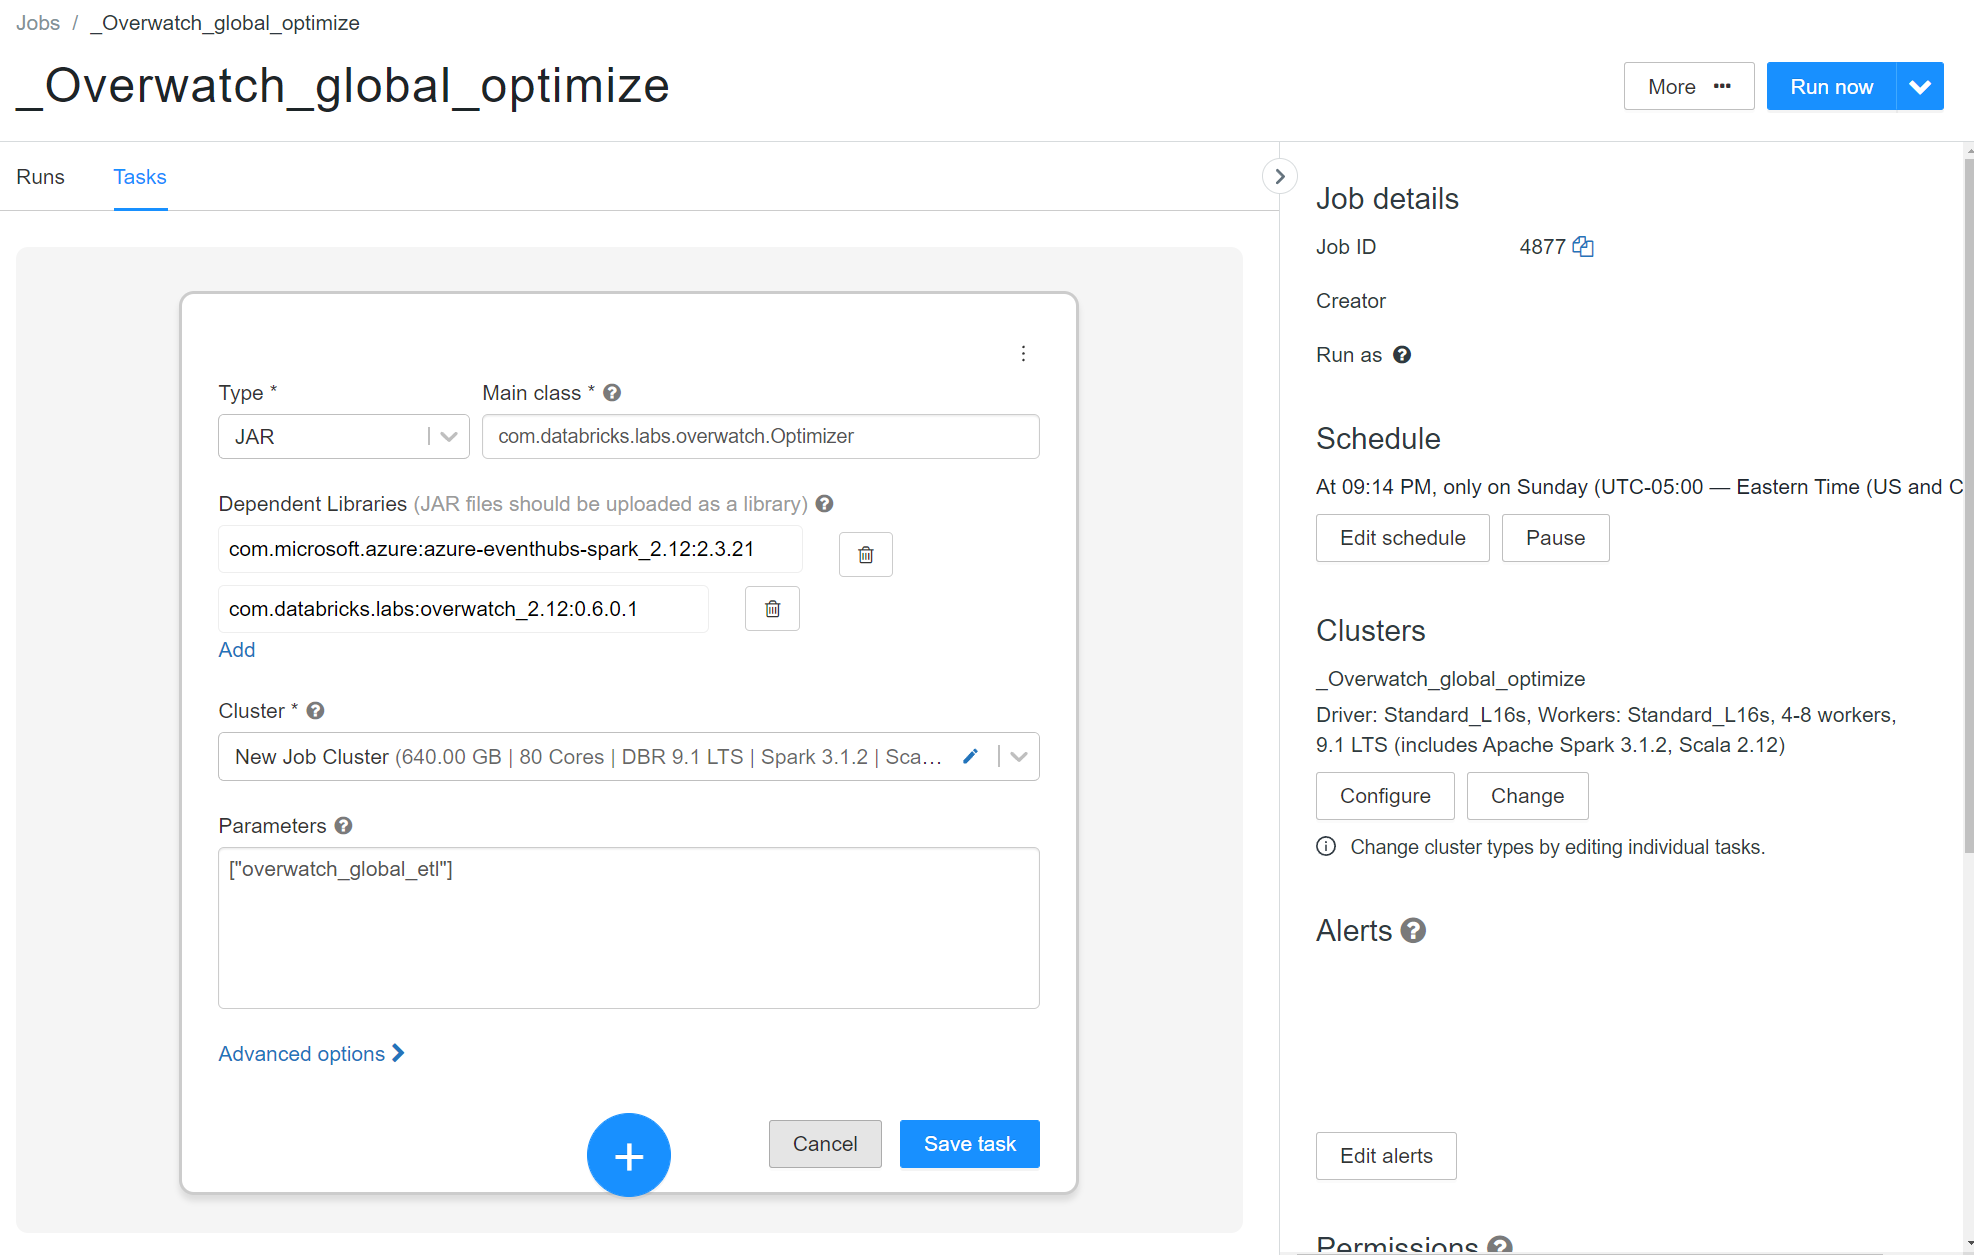
To externalize the optimize and z-order tasks:
- Set externalizeOptimize to true in the runner notebook config (All Workspaces)
- If running as a job don’t forget to update the job parameters with the new escaped JSON config string
- Create a job to execute the optimize on the workspace you wish (One Workspace - One Job)
- Type: JAR
- Main Class:
com.databricks.labs.overwatch.Optimizer - Dependent Libraries:
com.databricks.labs:overwatch_2.12:<LATEST> - Parameters:
["<Overwatch_etl_database_name>"] - Cluster Config: Recommended
- DBR Version: 11.3LTS
- Photon: Optional
- Enable Autoscaling Compute with enough nodes to go as fast as you want. 4-8 is a good starting point
- AWS – Enable autoscaling local storage
- Worker Nodes: Storage Optimize
- Driver Node: General Purpose with 16+ cores
- The driver gets very busy on these workloads - recommend 16 - 64 cores depending on the max size of the cluster
Interacting With Overwatch and its State
Use your production notebook (or equivallent) to instantiate your Overatch Configs.
From there use JsonUtils.compactString to get the condensed parameters for your workspace.
NOTE you cannot use the escaped string, it needs to be the compactString.
Below is an example of getting the compact string. You may also refer to the example runner notebook for your cloud provider.
val params = OverwatchParams(...)
print(JsonUtils.objToJson(params).compactString)
Instantiating the Workspace
As Of 0.6.0.4 Utilize Overwatch Helper functions get the workspace object for you. The workspace object returned will be the Overwatch config and state of the current workspace at the time of the last successful run.
As of 0.6.1 this helper function is not expected to work across versions, meaning that if the last run was on 0.6.0.4 and the 0.6.1 JAR is attached, don’t expect this method to work
import com.databricks.labs.overwatch.utils.Helpers
val prodWorkspace = Helpers.getWorkspaceByDatabase("overwatch_etl")

// for olderVersions use the compact String
// import com.databricks.labs.overwatch.pipeline.Initializer
// Get the compactString from the runner notebook you used for your first run example BE SURE your configs are the same as they are in prod
// val workspace = Initializer("""<compact config string>""")
Using the Workspace
Now that you have the workspace you can interact with Overwatch very intuitively.
Exploring the Config
prodWorkspace.getConfig.*
After the last period in the command above, push tab and you will be able to see the entire derived configuratin and it’s state.
Interacting with the Pipeline
When you instantiate a pipeline you can get stateful Dataframes, modules, and their configs such as the timestamp from which a DF will resume, etc.
val bronzePipeline = Bonze(prodWorkspace)
val silverPipeline = Silver(prodWorkspace)
val goldPipeline = Gold(prodWorkspace)
bronzePipeline.*
Instantiating a pipeline gives you access to its public methods. Doing this allows you to navigate the pipeline and its state very naturally
Using Targets
A “target” is essentially an Overwatch-defined table with a ton of helper methods and attributes. The attributes are closed off in 0.5.0 but Issue 164 will expose all reasonably helpful attributes making the target definition even more powerful.
Note that the scala filter method below will be simplified in upcoming release, referenced in Issue 166
val bronzeTargets = bronzePipeline.getAllTargets
val auditLogTarget = bronzeTargets.filter(_.name === "audit_log_bronze") // the name of a target is the name of the etl table

// a workspace level dataframe of the table. It's workspace-level because "global filters" are automatically
// applied by defaults which includes your workspace id, thus this will return the dataframe of the audit logs
// for this workspace
val auditLogWorkspaceDF = auditLogTarget.asDF()

// If you want to get the global dataframe
val auditLogGlobalDF = auditLogTarget.asDF(withGlobalFilters = false)
Getting a Strong First Run
The first run is likely the most important as it initializes all the slow-changing dimensions and sets the stage for subsequent runs. Follow the steps below to get a strong start.
Test First
Let’s test before trying to dive right into loading a year+ of historical data. Set the primordial date to today - 5 days and run the pipeline. Then review the pipReport:
display(
  table("overwatch_etl.pipReport")
    .orderBy('Pipeline_SnapTS.desc)
)
and validate that all the modules are operating as expected. Once you’re certain all the modules are executing properly, run a full cleanup and update the parameters to load historical data and begin your production deployment.
Historical Loading
Recommended max historical load is 30 days on AWS and 7 days on Azure.
DISABLE SPOT INSTANCES – when loading historical data, the last thing you want is to get nearly complete loading non-splittable sources just to have the node killed to spot instance termination and have to restart the process. It’s likely more expensive to try and complete your first run with spot instances enabled. This may also be true in production daily runs but it determines on your spot market availability and how often nodes are reclaimed during your daily run.
If you’re in AWS and planning to load a year of historical data because you have the audit logs to warrant it, that’s great but note that several of the critical APIs such as clusterEvents and sqlQueryHistory don’t store data for that long. ClusterEvents in particular is key for calculating utilization and costs; thus you need to determine if the historical data you’re going to get is really worth loading all of this history. Additionally, sparkEvents will only load so much history based on cluster log availability and will likely not load logs for historically transient clusters since Overwatch will look for the clusterEvents, they will be missing for a jobs cluster from 6 months ago and Overwatch will determine there’s no activity on the cluster and not scan its directories.
Lastly, note that several of the sources in bronze aren’t highly parallelizable due to their sources; this means that throwing more compute at this problem will only provide limited benefits.
Empty / Test / POC workspaces Aren’t A Valid Test
If most of your scopes are empty (i.e. you’ve never run any jobs and only have 1 cluster without logging enabled) most of the modules will be skipped and provide no insight as to if Overwatch is configured correctly for production.
Cluster Logs Ingest Details
For Overwatch to load the right-side of the ERD (Spark UI) the compute that executes the Spark Workloads must have cluster logging enabled and Overwatch must be able to load these logs. To do this, Overwatch uses its own data to determine the logging locations of all clusters and identifies clusters that have created logs within the Pipeline run’s time window (i.e. Jan 1 2023 –> Jan 2 2023).
Historically (legacy deployments), this was fairly simple as all the logging locations were generally accessible from the workspace on which Overwatch Pipeline was running (since there was one Overwatch Pipeline on each workspace). There was massive demand to enable remote workspace monitoring such that Overwatch is only needed to be deployed on a single workspace and can monitor one or many local/remote workspaces from a centralized location.
As a result of this, the security requirements became a bit more involved to ensure the Overwatch cluster has access to all the storage where clusters persist their logs. An Overwatch cluster on workspace 1 cannot simply access logs on workspace 2 at some mounted location since the mounted location on workspace 2 may actually map to a different target than it does on workspace 1. To solve this, Overwatch uses a “search-mounts” api to translate remote mounts to fully-qualified storage paths; as such the Overwatch cluster must be authorized to directly access the fully-qualified storage path hence the need for additional security authorizations. If this is not something that is possible for your organization, you may still use the new deployment method and simply deploy Overwatch on each workspace similar to the traditional method and nothing changes.
For AWS – ensure the Overwatch cluster has access to the remote s3:// paths to which clusters log
For Azure – An SPN should be provisioned and authorized to read to all abfss:// storage accounts / containers to which cluters log. See Security Consideration for more details on how to add the SPN configuration to the Overwatch Cluster..
Cluster Logs Loading Scenarios
Examples often help simplify complex details so let’s examine some scenarios. Given that Workspace 123 is where Overwatch is deployed and you would like to monitor workspaces 123 and 456 with Overwatch from the single 123 deployment. You deploy Overwatch on Workspace 123 and configure 456 as a remote but now you need to figure out how to get cluster on workspace 123 to access all the storage in the remote workspace[s]. This is where some governance and cluster policies come in handy – if you’re organization is already forcing clusters to log to a limited number of storage accounts / buckets then provisioning access here isn’t too difficult.
The image below illustrates how the traffic flows along with several notes about how cluster log acquisition works
for local and remote workspaces.
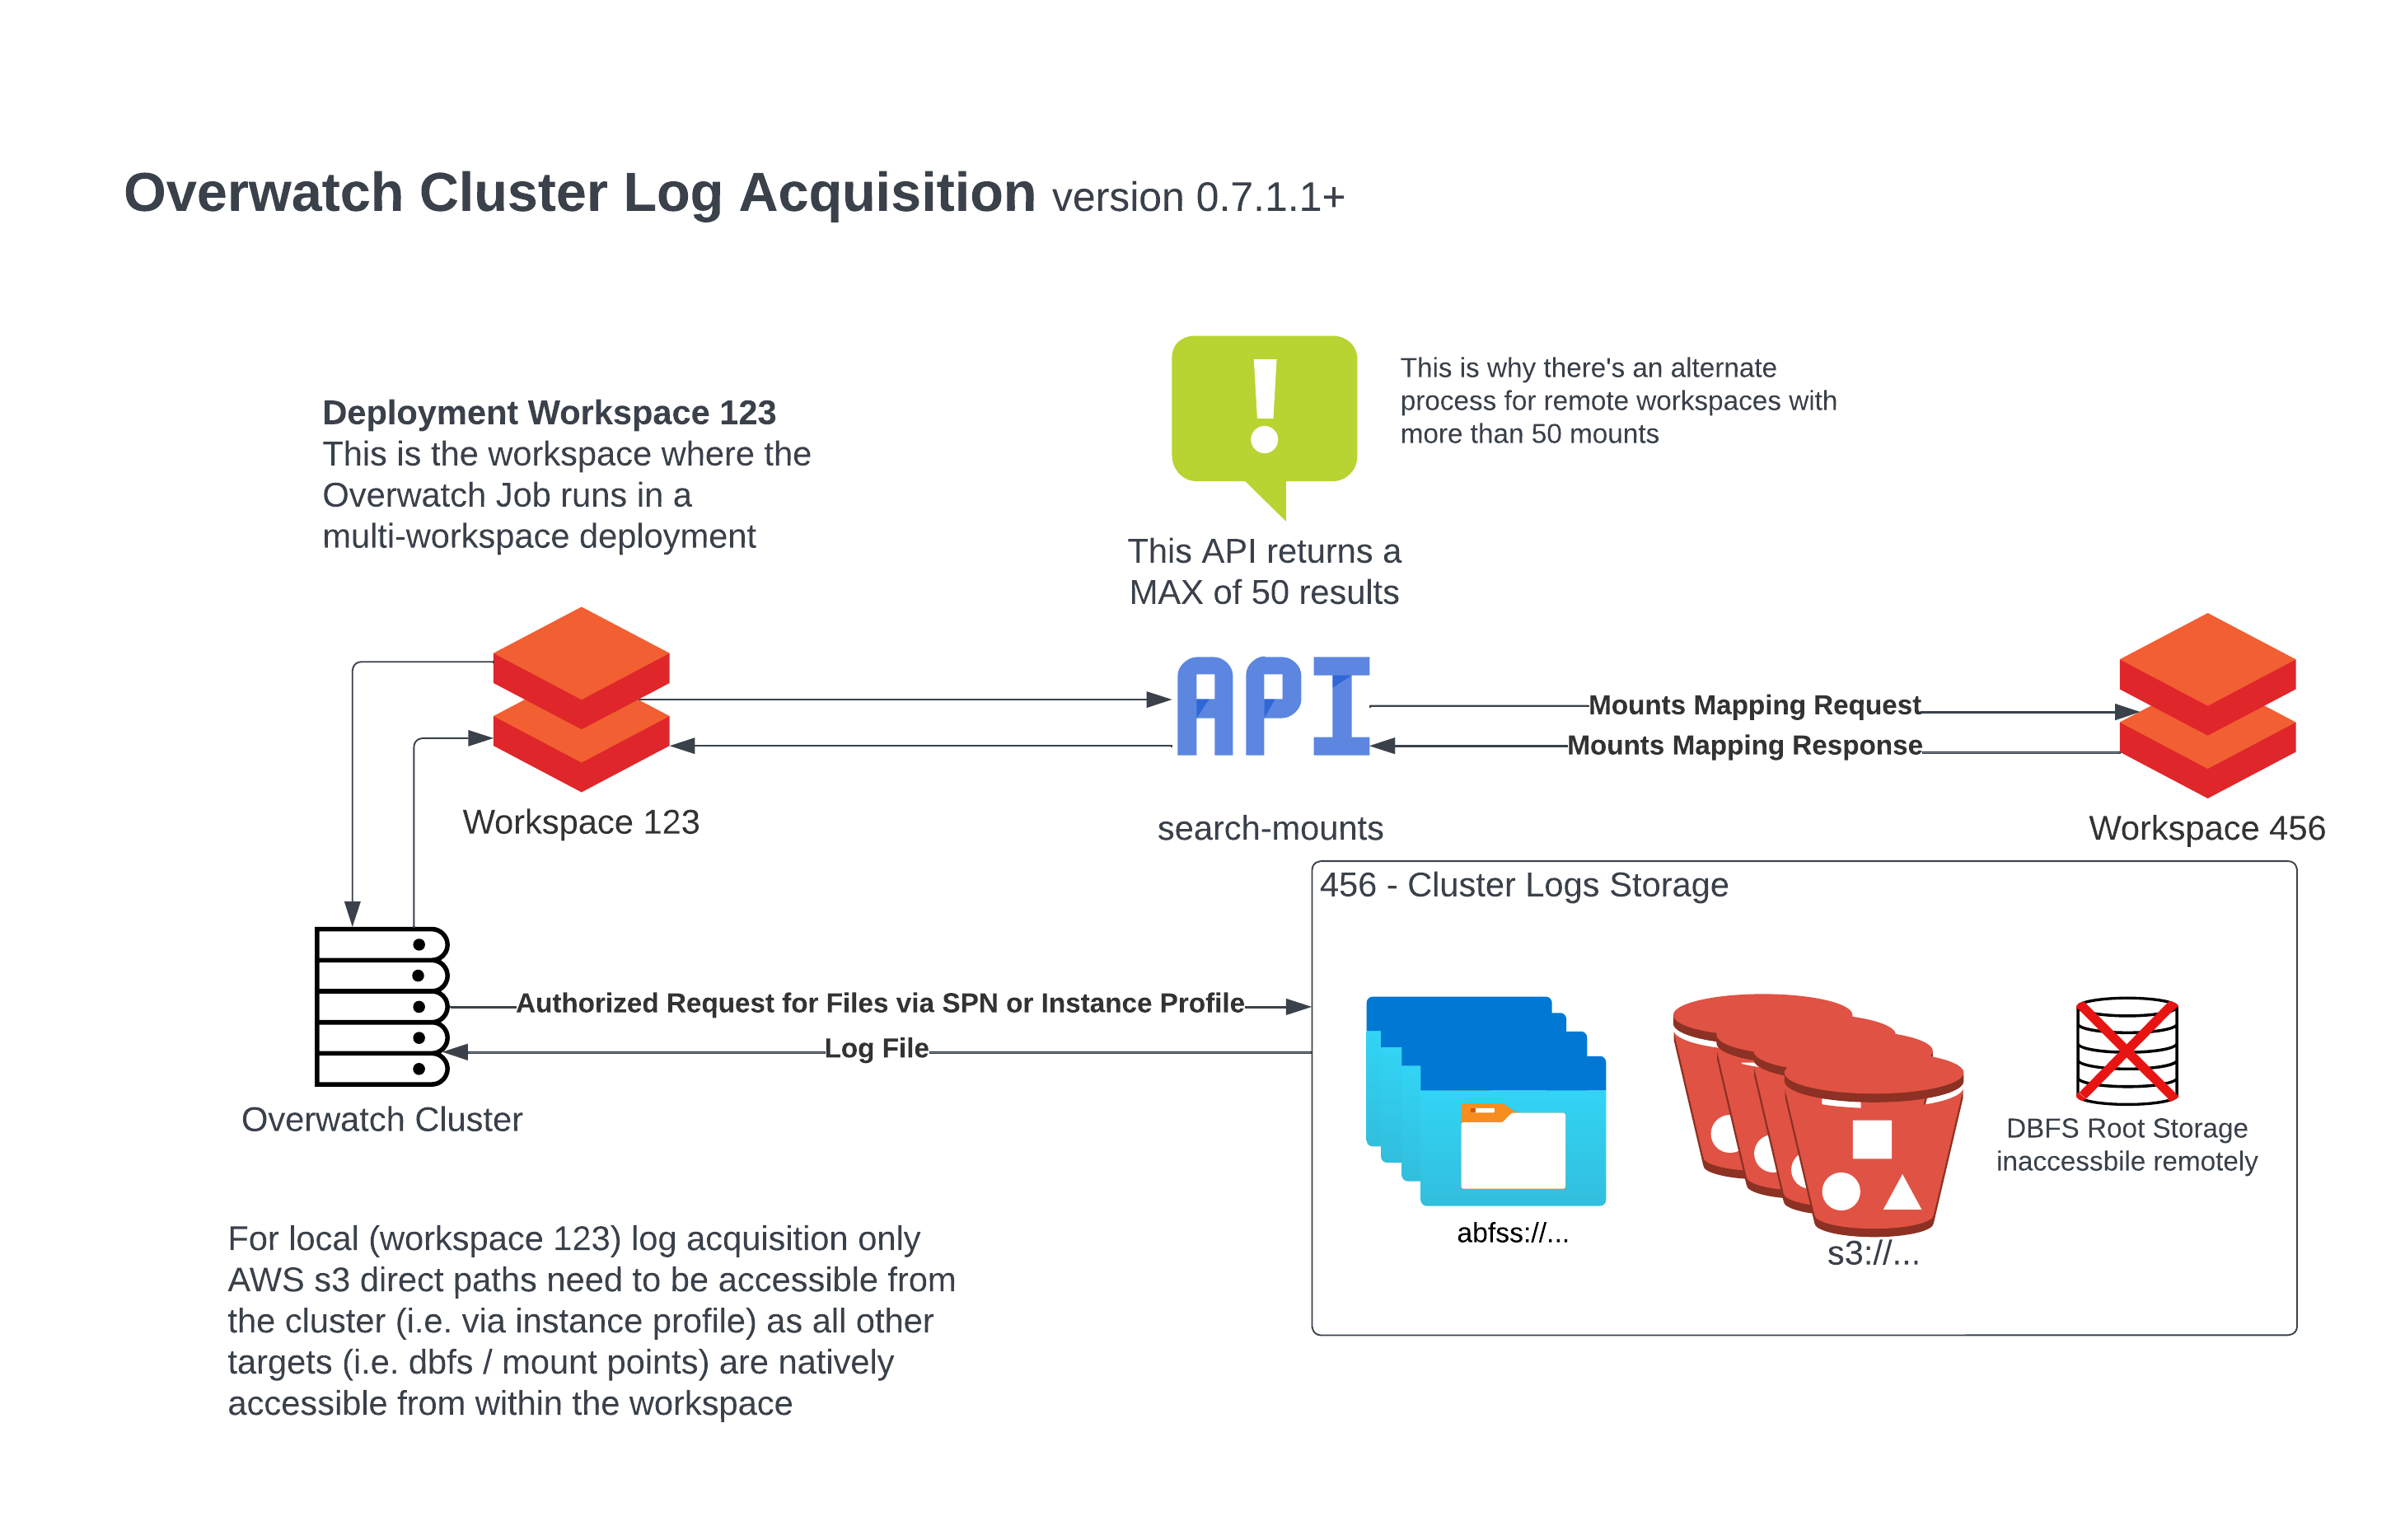
Given the above diagram and a cluster logging path, below is a table of access scenarios. Notice the “Overwatch Reads Logs From” field which demonstrates from which path Overwatch will load the logs in the given scenario; the Overwatch cluster must have access to read from that location.
| Workspace | Cluster Logging Path | Is Mounted | Fully Qualified Storage Location | Accessible From Deployment Workspace | Overwatch Reads Logs From | Comments |
|---|---|---|---|---|---|---|
| 123 | dbfs:/mnt/cluster_logs (AWS) | True | s3://myCompany/logsBucket/123 | True | dbfs:/mnt/cluster_logs | Locally mounted locations are directly accessed on deployment workspace |
| 123 | dbfs:/mnt/cluster_logs (Azure) | True | abfss://mylogsContainer123@myComany… | True | dbfs:/mnt/cluster_logs | Locally mounted locations are directly accessed on deployment workspace |
| 123 | dbfs:/unmounted_local_path | False | dbfs:/unmounted_local_path | True | dbfs:/unmounted_local_path | Locally mounted locations are directly accessed on deployment workspace |
| 123 | s3://myCompany/logsBucket/123 (AWS) | False | s3://myCompany/logsBucket/123 | True* | s3://myCompany/logsBucket/123 | AWS - Direct s3 path access as configured in cluster logs |
| 456 | dbfs:/mnt/cluster_logs (AWS) | True | s3://myCompany/logsBucket/456 | True* | s3://myCompany/logsBucket/456 | Remote mount point is translated to fully-qualified path and remote storage is access directly |
| 456 | dbfs:/mnt/cluster_logs (Azure) | True | abfss://mylogsContainer456@myComany… | True* | abfss://mylogsContainer456@myComany… | Remote mount point is translated to fully-qualified path and remote storage is access directly |
| 456 | dbfs:/unmounted_local_path | False | dbfs:/unmounted_local_path | False | Inaccessible | Root dbfs storage locations are never accessible from outside the workspace |
| 456 | s3://myCompany/logsBucket/456 (AWS) | False | s3://myCompany/logsBucket/456 | True* | s3://myCompany/logsBucket/456 | AWS - Direct s3 path access as configured in cluster logs |
* (AWS) Assuming Instance Profile authroized to the fully qualified path location and configured
* (AZURE) Assuming SPN authroized to the fully qualified path location and configured on the Overwatch cluster
Exception - Remote Workspaces With 50+ Mounts
In the image above, you likely noticed the alert. As of version 0.7.1.1, Overwatch can handle remote workspaces with more than 50 mounts through an alternative process.
When a remote workspace has > 50 mounts and 1 or more clusters log to a mounted location, the following process must be followed to acquire the logs for that path.
Remote Workspaces With 50+ Mounts Config Process
The process below will allow you to bypass the API limitation and manually acquire all the mounts and their maps for a workspace as a CSV. Upload this to an accessible location on the deployment workspace (i.e. Workspace 123) and add it to the configuration for that workspace.
Continuing the example from above, if Workspace 456 had > 50 mounts
- Log into the remote workspace (Workspace 456)
- Import and Execute this Notebook HTML | DBC
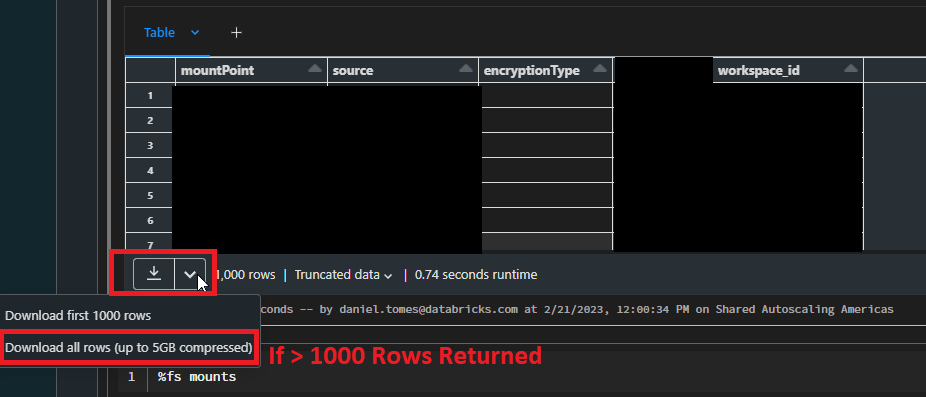
- Follow instruction in the notebook to download the results as CSV.
- Download the results (all of them – follow closely if > 1000 mounts)
- Name the file something meaningful so you know it corresponds to Workspace 456 (i.e. mounts_mapping_456.csv)
- Upload to accessible location in deployment workspace (Workspace 123) such as dbfs:/Filestore/overwatch/mounts_mapping_456.csv
- Add the path to the mount_mapping_path in the multi-workspace config.
Download Screenshot Example If more than 1000 mounts use follow the screenshot exactly otherwise just hit the
down arrow to download
Now Overwatch can bypass the API limitation of only being able to access 50 mounts for this remote workspace. Repeat this process for all workspaces that have >50 mounts. Leave the “mount_mapping_path” emtpy for the workspaces that do not have >50 mounts and Overwatch will use the api to automatically map the mount points to fully-qualified storage paths for you.
WHY SO COMPLICATED The Databricks API does not support pagination and will only return a max of 50 results. This process is meant as a work-around method until Databricks can update this API to support higher max results, filters, and/or pagination at which time the subsequent release of Overwatch will omit this complexity.
Joining With Slow Changing Dimensions (SCD)
The nature of time throughout the Overwatch project has resulted in the need to for advanced time-series DataFrame management. As such, a vanilla version of databrickslabs/tempo was implemented for the sole purpose of enabling Scala time-series DataFrames (TSDF). TSDFs enable “asofJoin” and “lookupWhen” functions that also efficiently handle massive skew as is introduced with the partitioning of organization_id and cluster_id. Please refer to the Tempo documentation for deeper info. When Tempo’s implementation for Scala is complete, Overwatch plans to simply reference it as a dependency.
This is discussed here because these functionalities have been made public through Overwatch which means you can easily utilize “lookupWhen” and “asofJoin” when interrogating Overwatch. The details for optimizing skewed windows is beyond the scope of this documentation but please do reference the Tempo documentation for more details.
In the example below, assume you wanted the cluster name at the time of some event in a fact table. Since cluster names can be edited, this name could be different throughout time so what was that value at the time of some event in a driving table.
The function signature for “lookupWhen” is:
  def lookupWhen(
                  rightTSDF: TSDF,
                  leftPrefix: String = "",
                  rightPrefix: String = "right_",
                  maxLookback: Long = Window.unboundedPreceding,
                  maxLookAhead: Long = Window.currentRow,
                  tsPartitionVal: Int = 0,
                  fraction: Double = 0.1
                ): TSDF = ???
import com.databricks.labs.overwatch.pipeline.TransformFunctions._
val metricDf = Seq(("cluster_id", 10, 1609459200000L)).toDF("partCol", "metric", "timestamp")
val lookupDf = Seq(
  ("0218-060606-rouge895", "my_clusters_first_name", 1609459220320L),
  ("0218-060606-rouge895", "my_clusters_new_name", 1609458708728L)
).toDF("cluster_id", "cluster_name", "timestamp")

metricDf.toTSDF("timestamp", "cluster_id")
  .lookupWhen(
    lookupDf.toTSDF("timestamp", "cluster_id")
  )
  .df
  .show(20, false)
API Traceability
The Overwatch pipeline runs in multiple threads, making numerous API calls in parallel and asynchronously to enhance processing speed. Due to the challenge of capturing lineage between requests and responses, a traceability module has been implemented. Through traceability, we can record the request made and the corresponding response received. All data captured as part of traceability will be stored in the apiEventDetails table, which can be found in the ETL database.
How to enable Traceability
By default, the traceability module is disabled. To enable traceability, please set the following configuration in the
advanced Spark settings: overwatch.traceapi true.
Column Descriptions of ApiEventDetails
| Column | Type | Description |
|---|---|---|
| end_point | String | Api call end point. |
| type | String | Type of api call. |
| apiVersion | String | Api call version. |
| batch_key_filter | String | Parameters that has been specified in the api call.It will be String of Json. |
| response_code | long | Response code for the api call. |
| data | String | Response which is stored in binary format. |
| moduleID | long | Id of the module from which Api call was initiated. |
| moduleName | String | Name of the module from which api call was initiated. |
| organization_id | Long | Id of the workspace. |
| snap_ts | timestamp | Time in which this row was inserted into the table. |
| timestamp | long | Timestamp in which this row was inserted into the table. |
| Overwatch_RunID | long | GUID for the overwatch run. |
How to read the binary data which has been stored in ApiEventDetails
The following function was introduced in version 0.8.1.0 to decode the binary data received into a readable format, which you can use as follows:
import com.databricks.labs.overwatch.utils._
val df = Helpers.transformBinaryDf(spark.read.table("<etl_db_name>.apieventdetails"))
display(df)
Using Overwatch Data to enrich realtime monitoring
A supported TSDB (time-series database) is required to enable and integrate this. Databricks cannot provide support for deployment / configuration of TSDBs but can assist in integrating Databricks clusters with supported TSDBs. Supported TSDBs include:
- Graphite
- Prometheus
- LogAnalytics (Azure)
Overwatch is often integrated with real-time solutions to enhance the data provided as raw Spark Metrics. For example, you may be monitoring jobs in real-time but want job_names instead of job_ids, Overwatch’s slow-changing dimensions can enhance this.
Real-time monitoring usually comes from at least two different sources:
- spark via DropWizard (a default spark monitoring platform)
- machine metrics via collectd or some native cloud solutions such as CloudWatch or LogAnalytics.
These real-time metrics can be captured as quickly as 5s intervals but it’s critical to note that proper historization is a must for higher intervals; furthermore, it’s critical to configure the metrics at the “correct” interval for your business needs. In other words, it can get quickly get expensive to load all metrics at 5s intervals. All of these details are likely common knowledge to a team that manages a time-series database (TSDB).
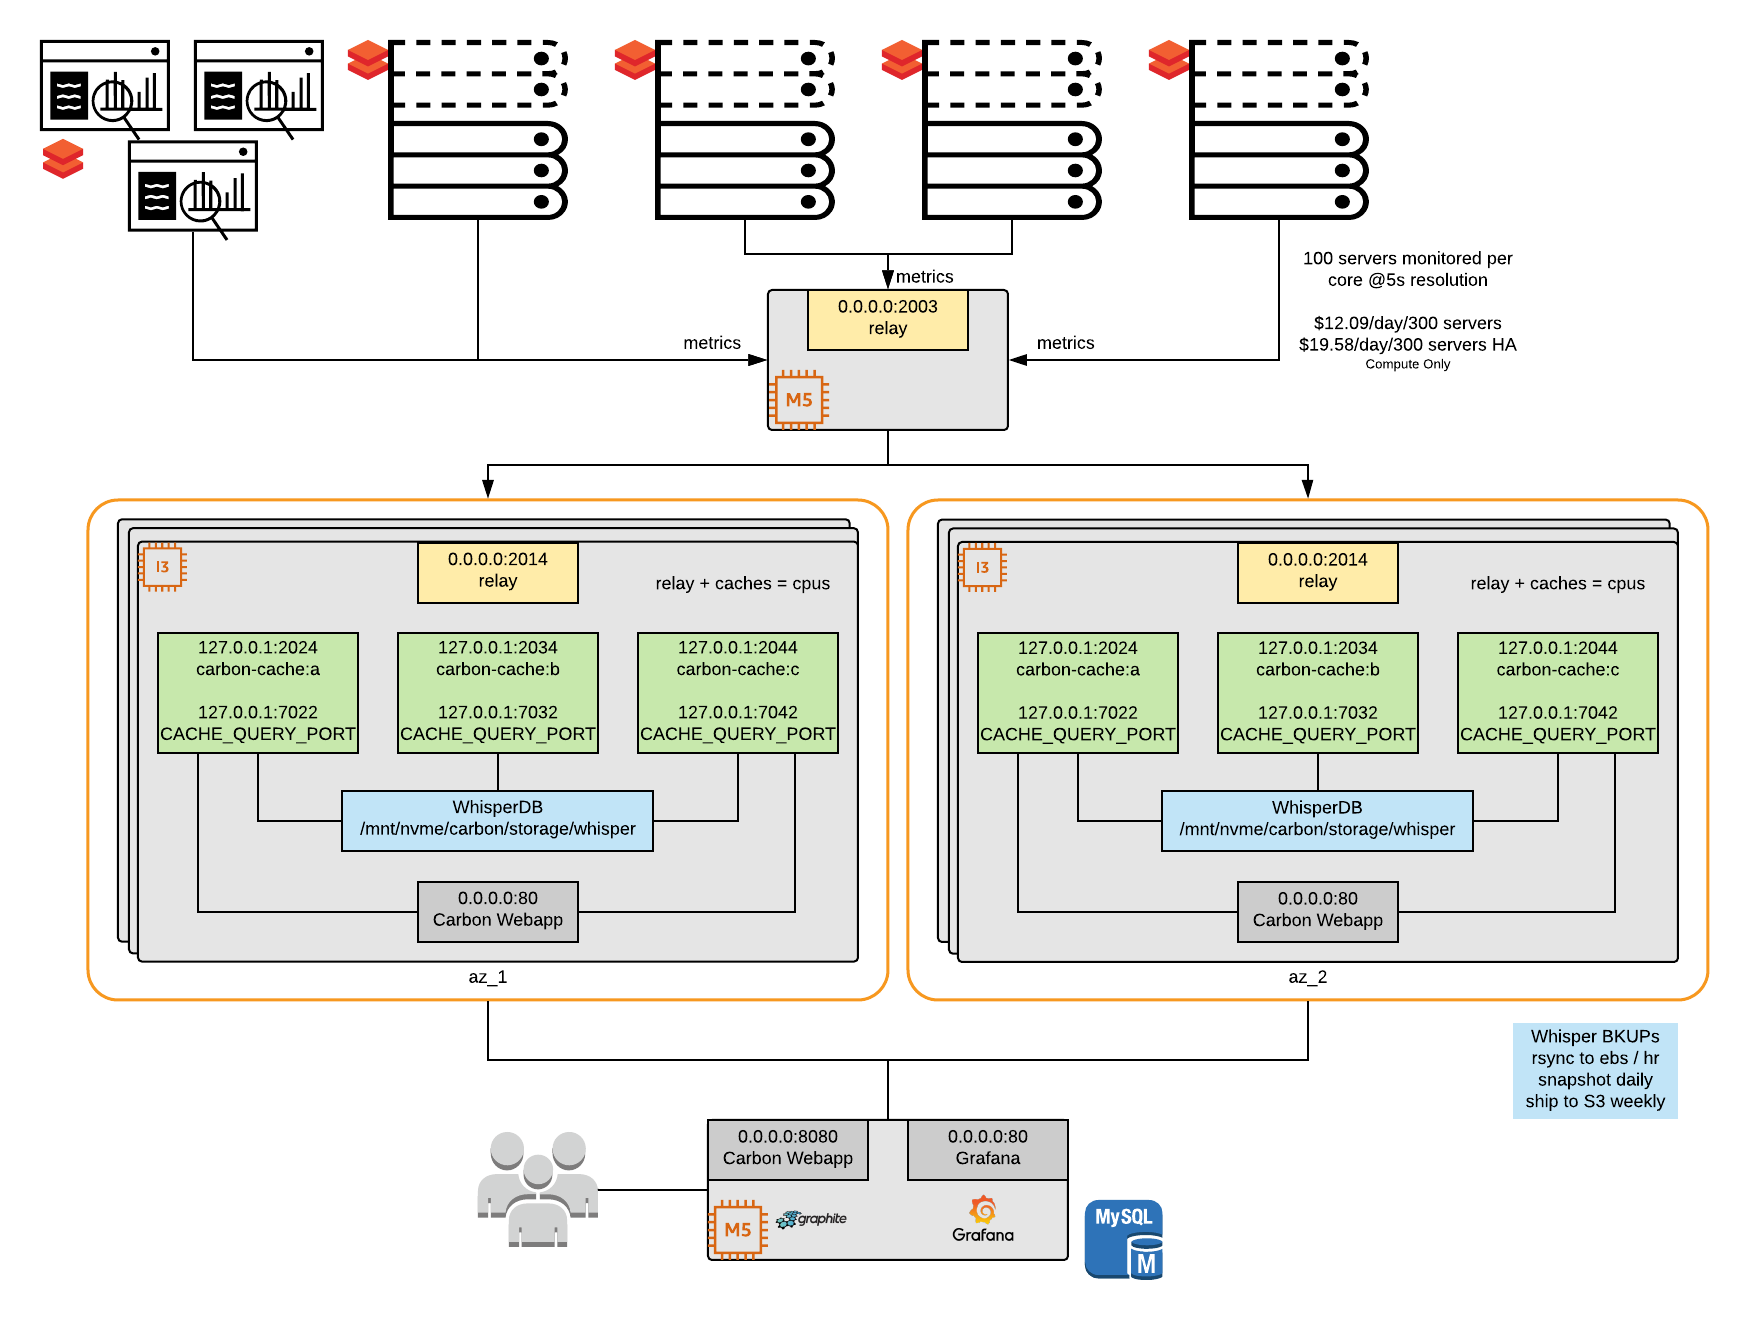
Below is a scalable, reference architecture using Graphite and Grafana to capture these metrics. Overwatch creates several daily JSON time-series compatible exports to Grafana JSON that provide slow-changing dimensional lookups between real-time keys and dimensional values through joins for enhanced dashboards.
Below is a link to a notebook offering samples for integrating Spark and machine metrics to some real-time infrastructure endpoint. The examples in this notebook offer examples to Prometheus, Graphite, and Log Analytics for Spark Metrics and collectD for machine metrics. Critical this is just a sample for review, this notebook is intended as a reference to guide you to creating your own implementation, you must create a script to be valid for your requirements and capture the right metrics and the right intervals for the namespaces from which you wish to capture metrics.
Realtime Getting Started Reference Notebook HTML | DBC
The realtime reference architecture has been validated but 1-click delivery has not yet been enabled. The time-series database / infrastructure setup is the responsibility of the customer; Databricks can assist with integrating the spark metrics delivery with customer infrastructure but Databricks cannot offer much depth for standing up / configuring the real-time infrastructure itself.
Example Realtime Architecture
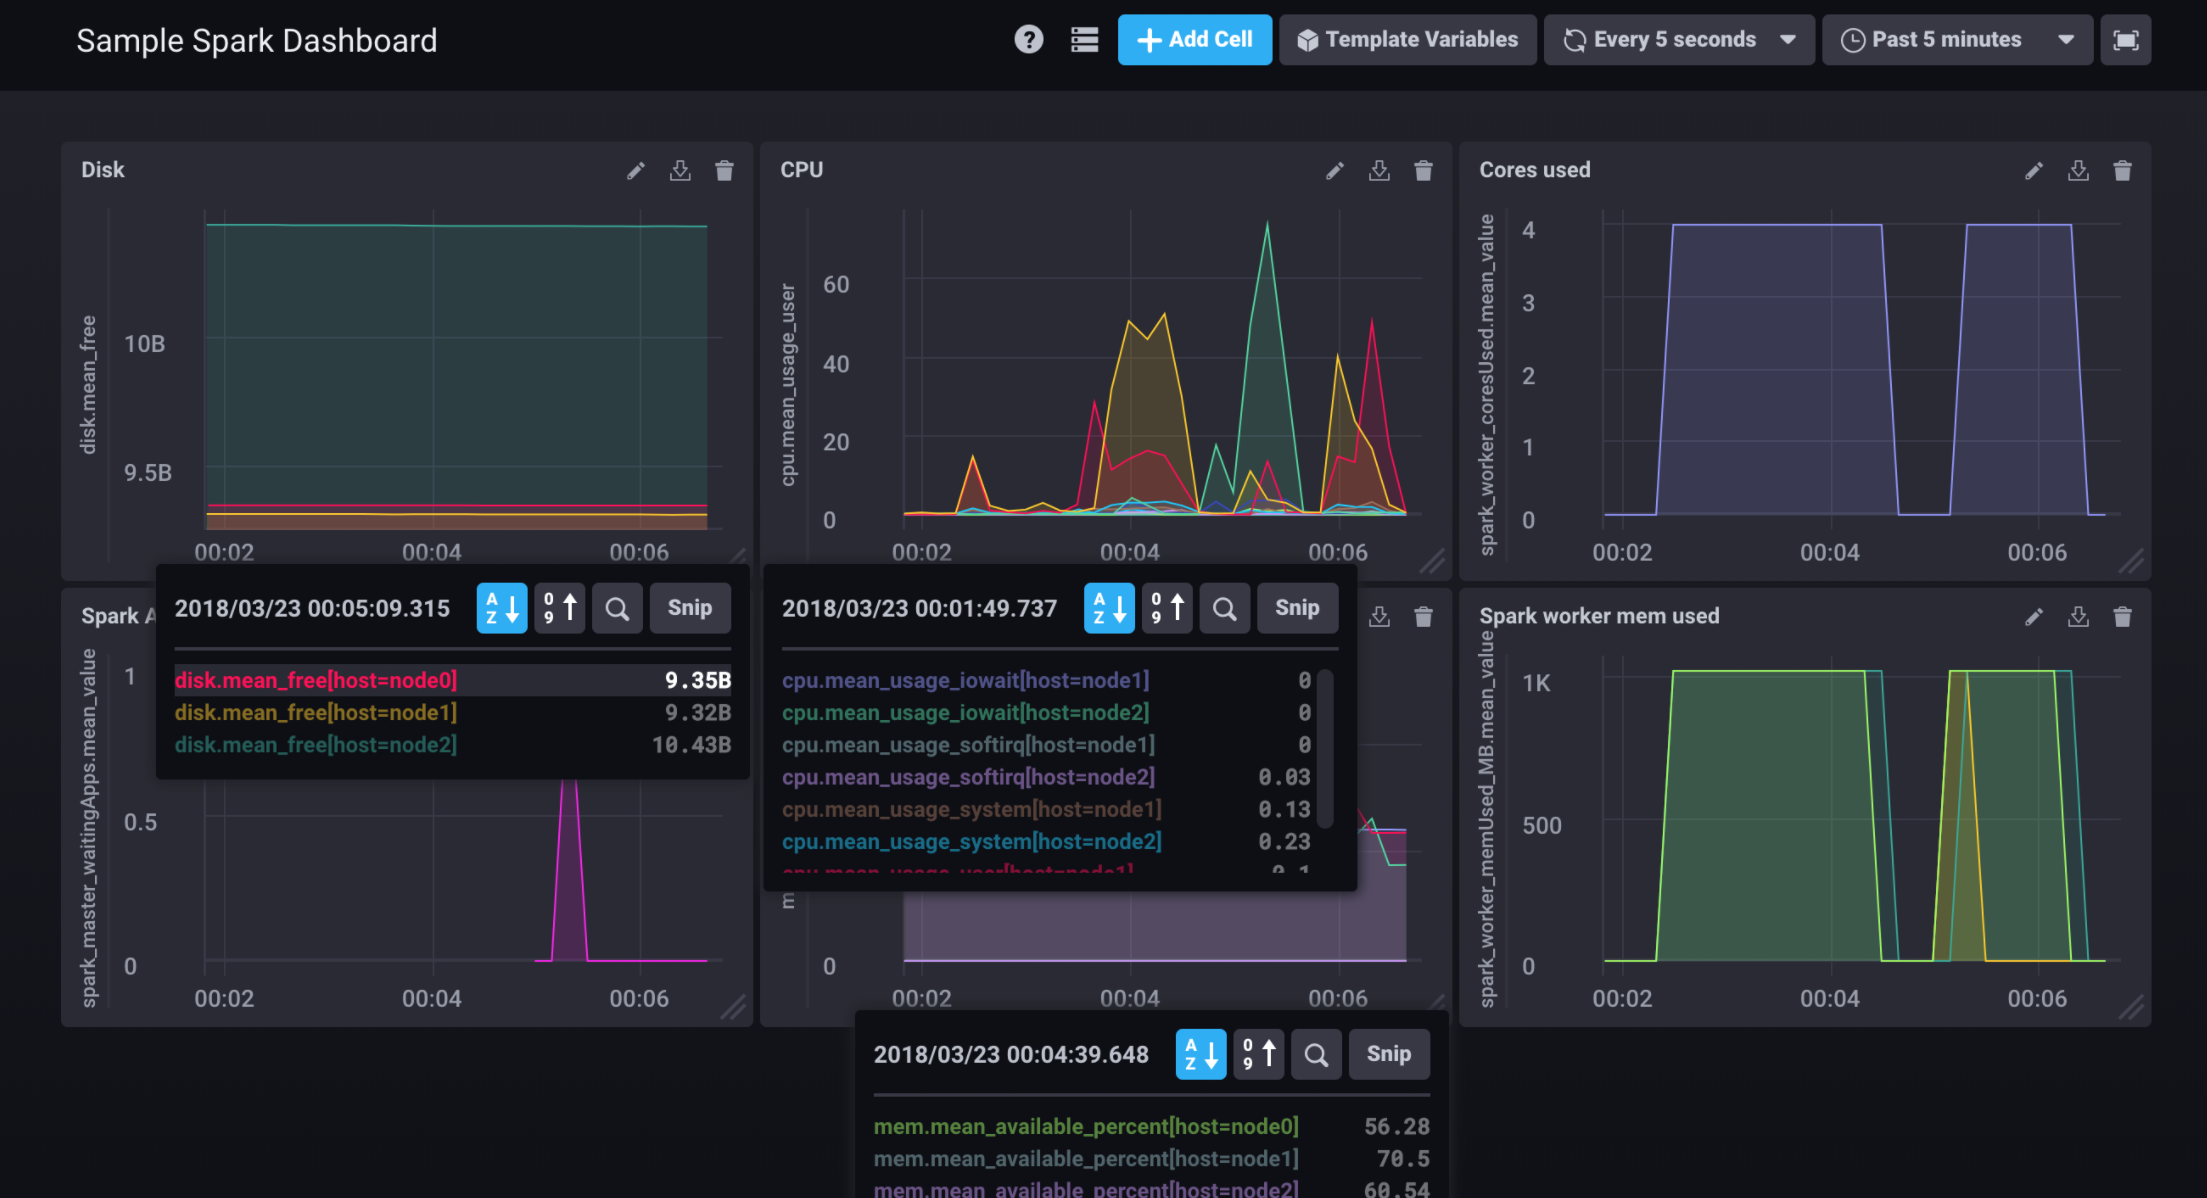
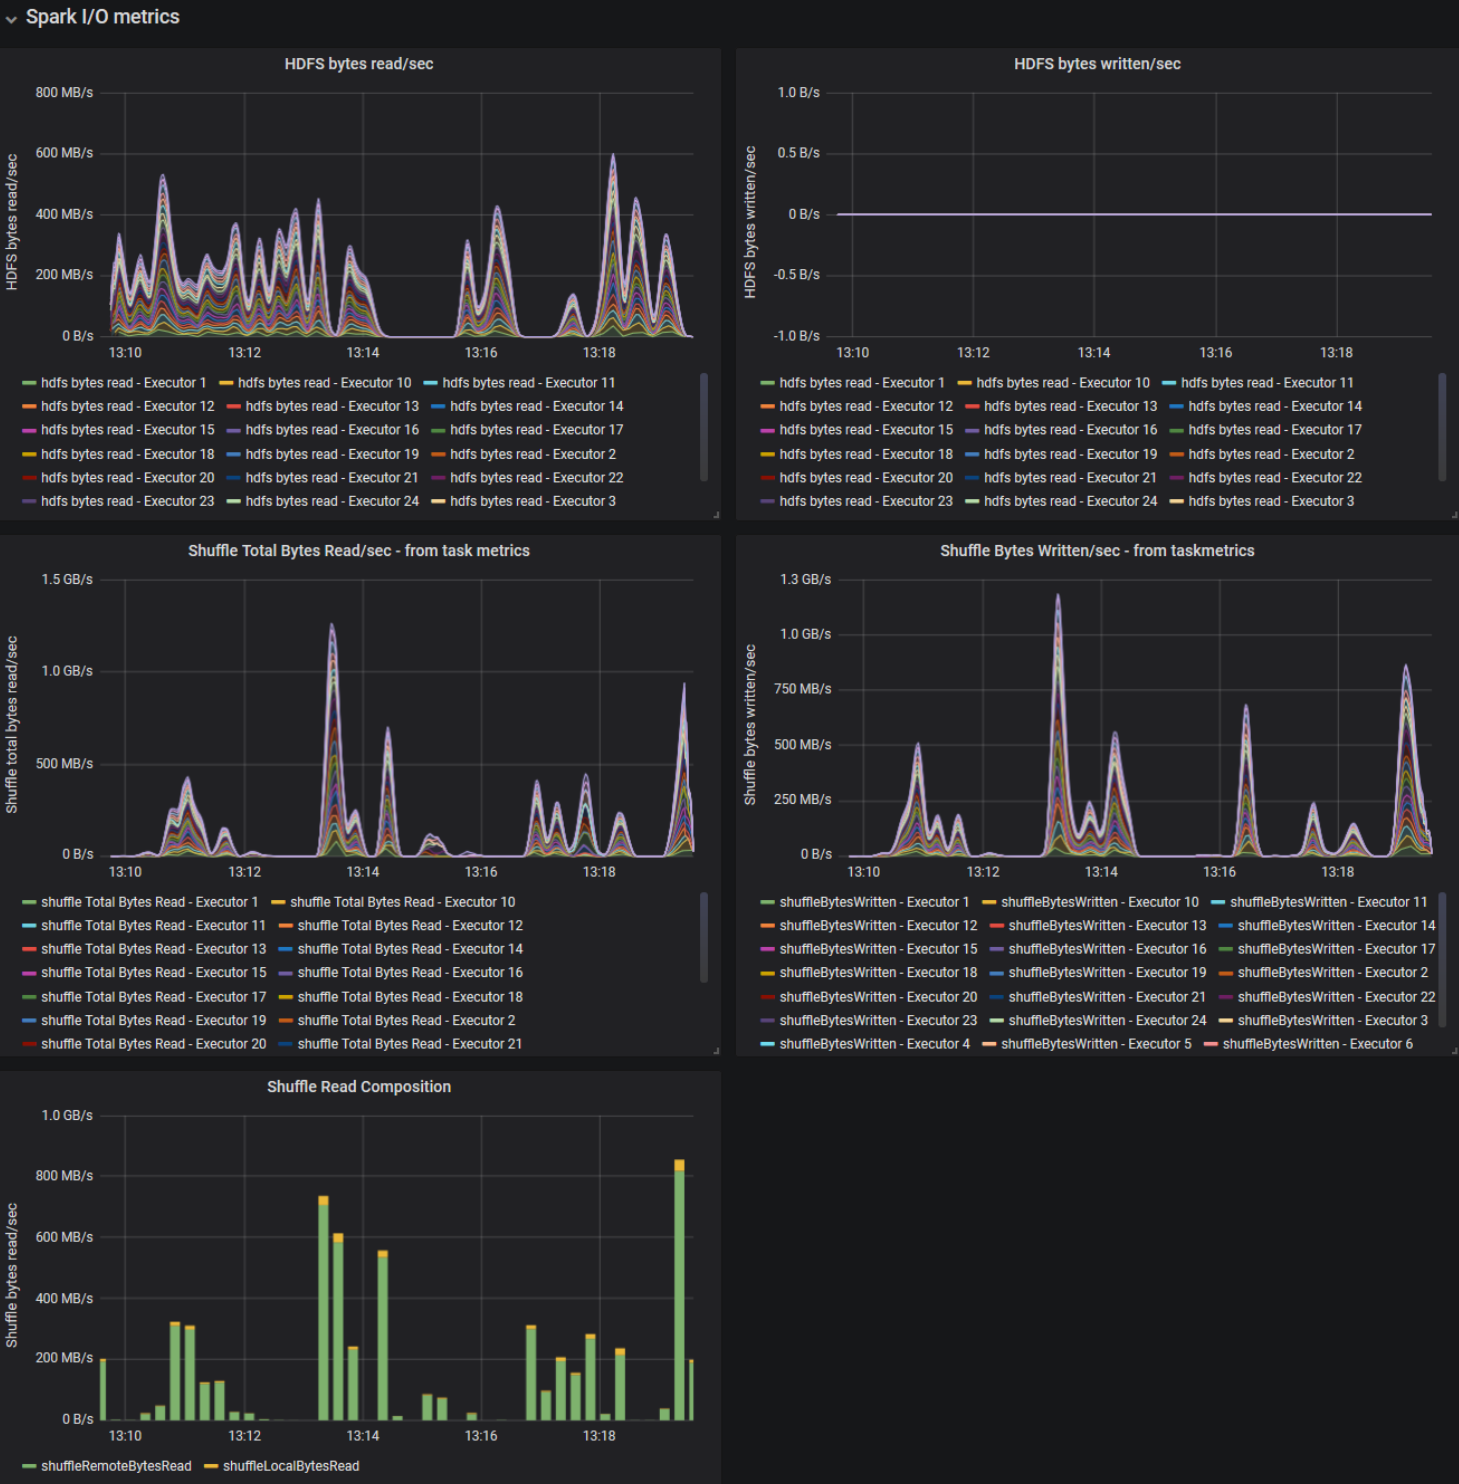
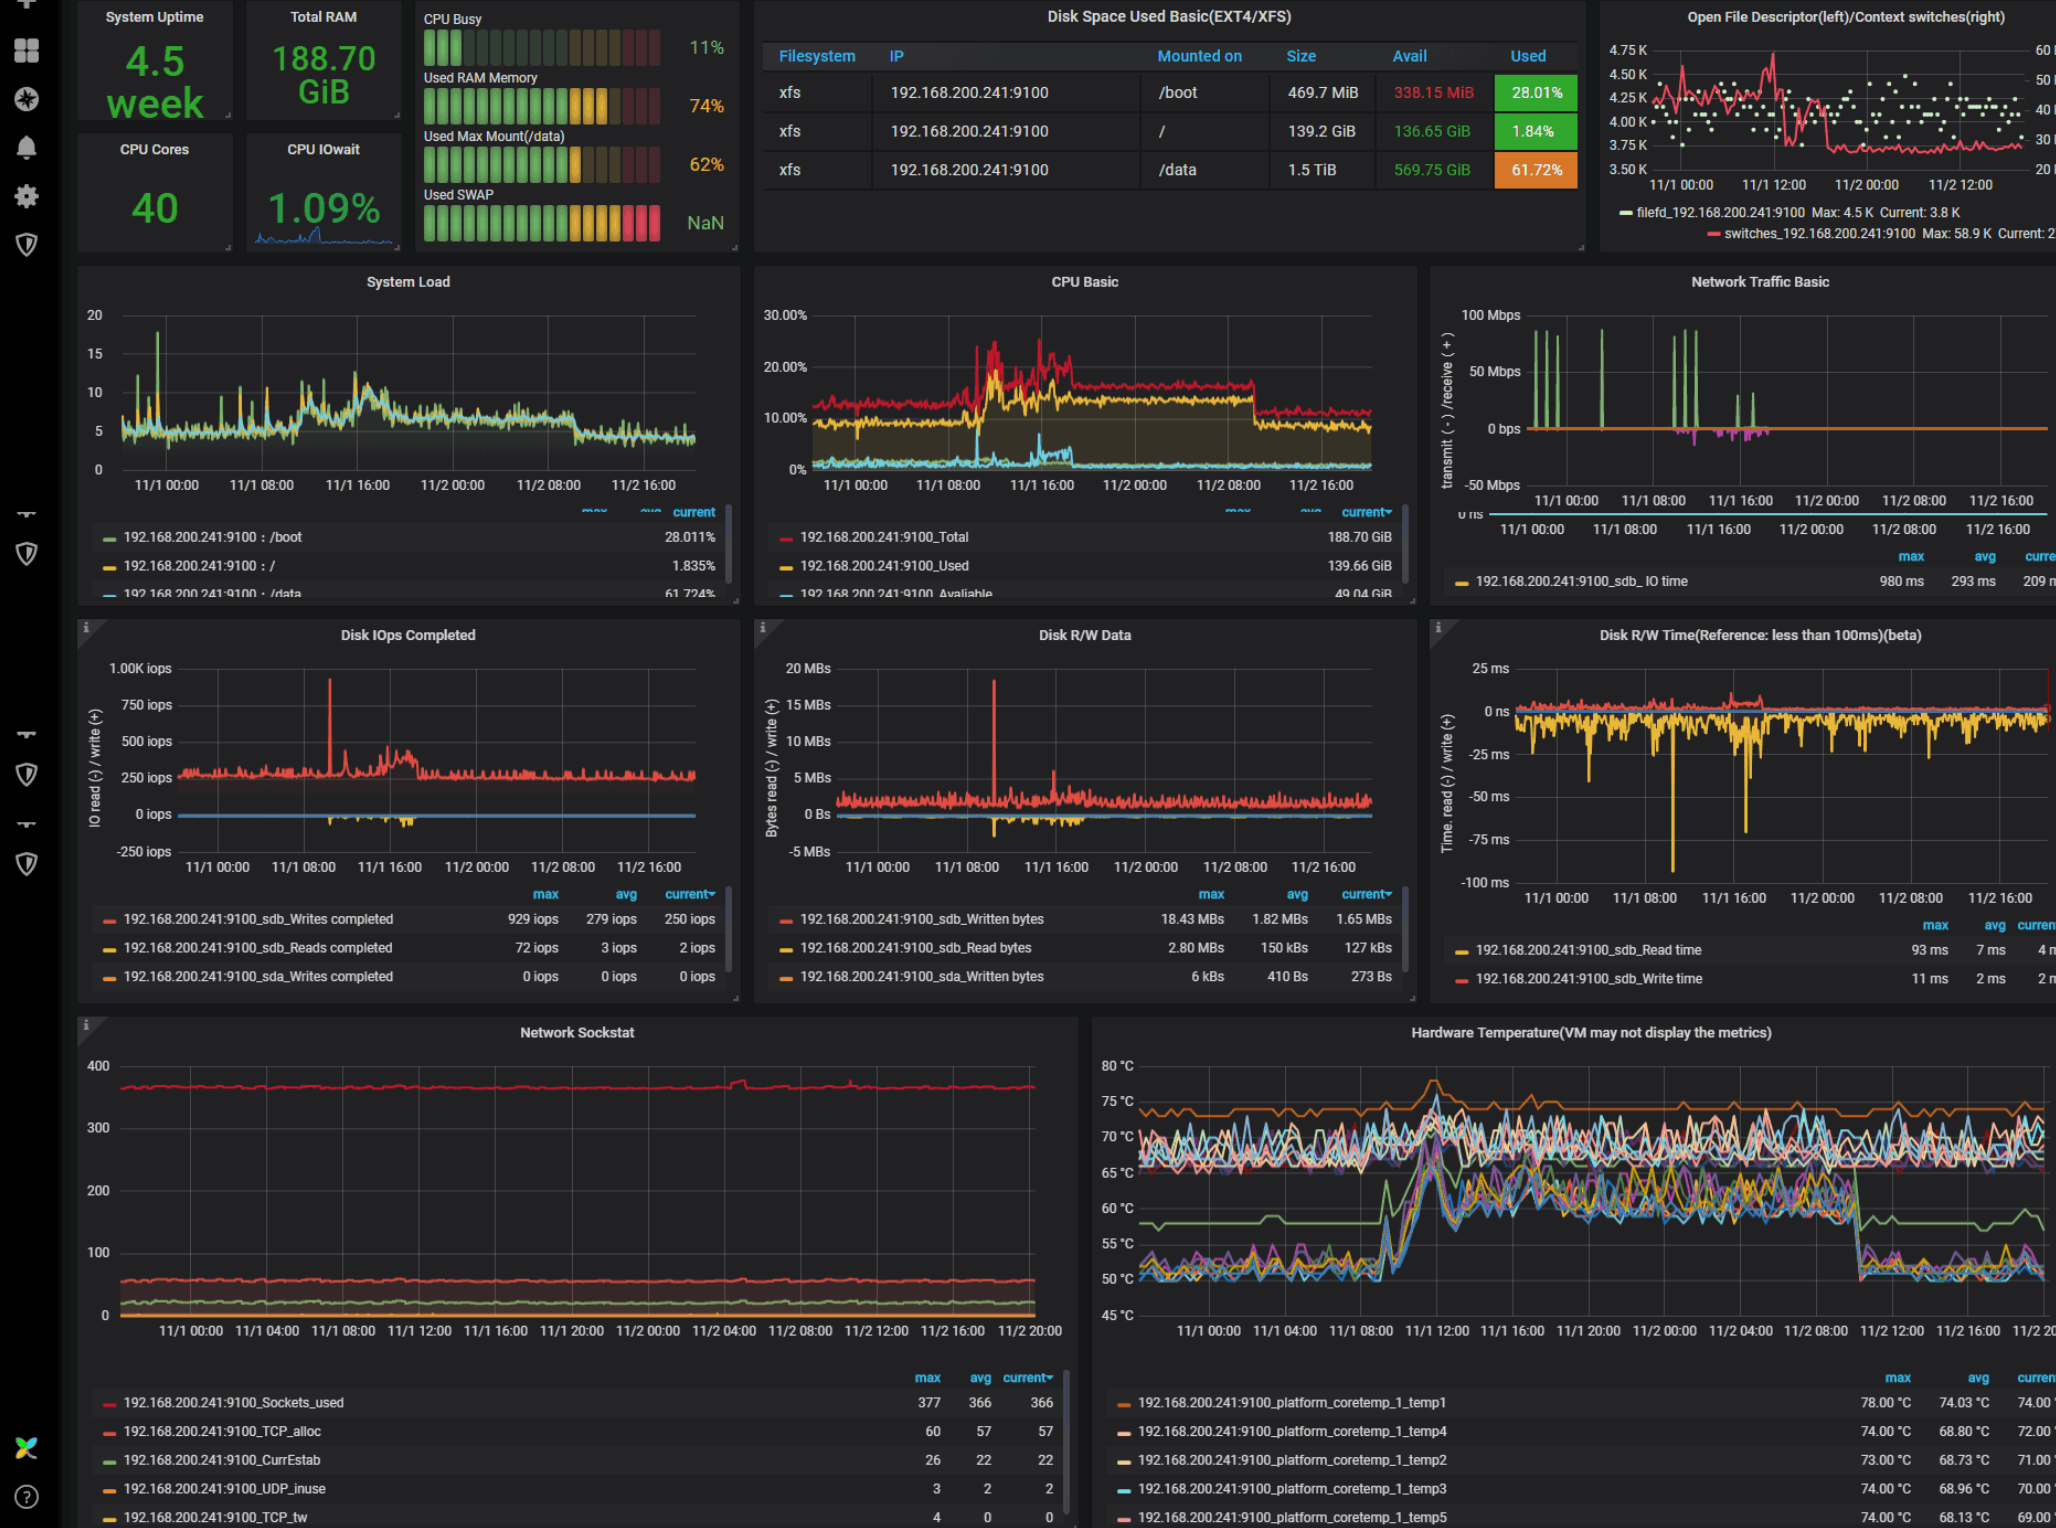
Example Realtime Dashboards
| Simple Spark Dashboard | IO Dashboard | Advanced Dashboard |
|---|---|---|
 |
 |
 |