This project is now deprecated. You can continue using the latest published version, but no further updates will be
released. For all your observability needs, please use Databricks System Tables
This project is now deprecated. You can continue using the latest published version, but no further updates will be released. For all your observability needs, please use Databricks System Tables
Project Overview
Overwatch was built to enable Databricks’ customers, employees, and partners to quickly / easily understand operations within Databricks deployments. As enterprise adoption increases there’s an ever-growing need for strong governance. Overwatch means to enable users to quickly answer questions and then drill down to make effective operational changes. Common examples of operational activities Overwatch assists with are:
- Cost tracking by various dimensions
- Governance at various dimensions
- Optimization Opportunities
- What If Experiments
How Much Does It Cost
Overwatch is currently a Databricks Labs project and has no direct cost associated with it other than the costs incurred with running the daily jobs. Audit logging is required and as such a Azure Databricks Premium SKU OR the equivalent AWS Premium Plan or above. As a reference, a cost analysis was performed at a large Databricks customer. This customer had >1000 named users with >400 daily active users with a contract price with Databricks over $2MM/year. Overwatch costs them approximately $8 USD / day to run which includes storage, compute, and DBUs. $8 / day == approximately $3,000 / year or 0.15% of Databricks contract price. This is just a single reference customer but cost monitoring for your Overwatch job should be the same as any other job you run. At the time of this writing Overwatch has only been deployed as a pilot and has already proven several million dollars in value. The savings customers found through these efficiency improvements allowed them to accelerate their backlogs, permanently lower the total cost of ownership, and even take on additional exploratory efforts.
How It Works
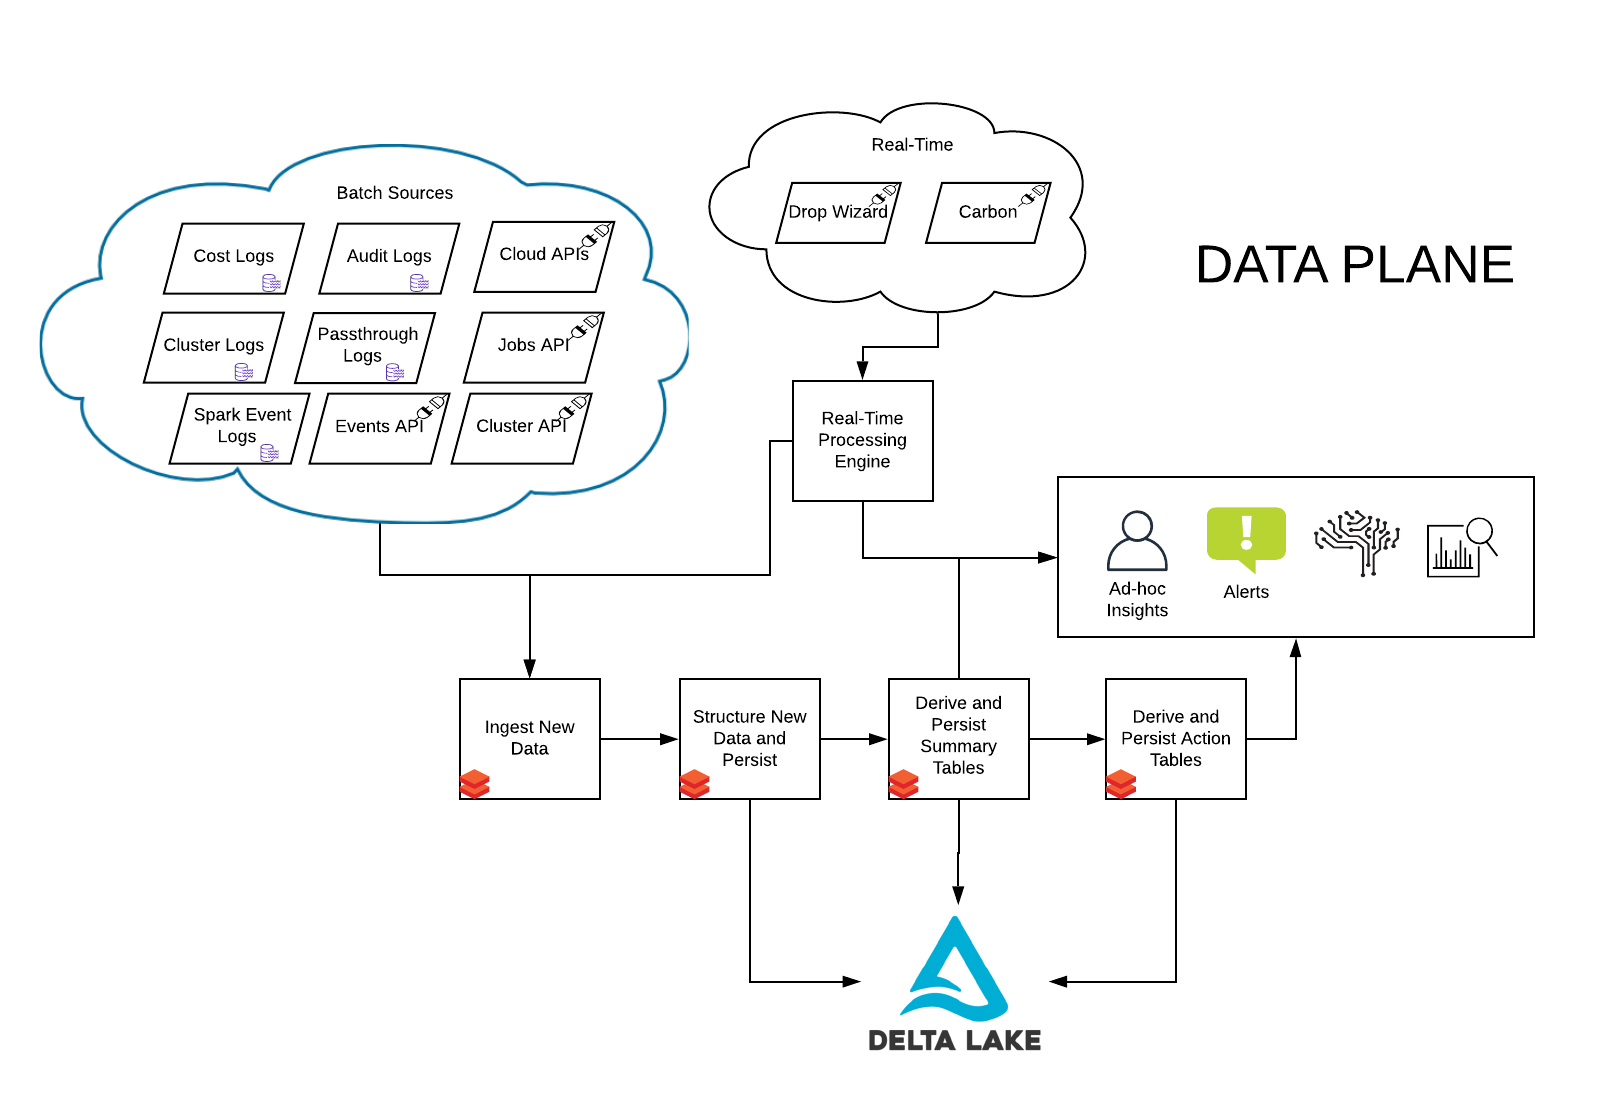
Overwatch amalgamates and unifies all the logs produced by Spark and Databricks via a periodic job run (typically 1x/day). The Overwatch job then enriches this data through various API calls to the Databricks platform and, in some cases, the cloud provider. Finally, all the data is pulled together into a data model that enables simplified queries for powerful insights and governance. Below are a few example reports produced by Overwatch. The batch / historical data is typically used to identify the proper boundaries that can later be used to set up monitoring / alerts in the real-time modules.
| Hot Notebooks | Heavy User Breakdown |
|---|---|
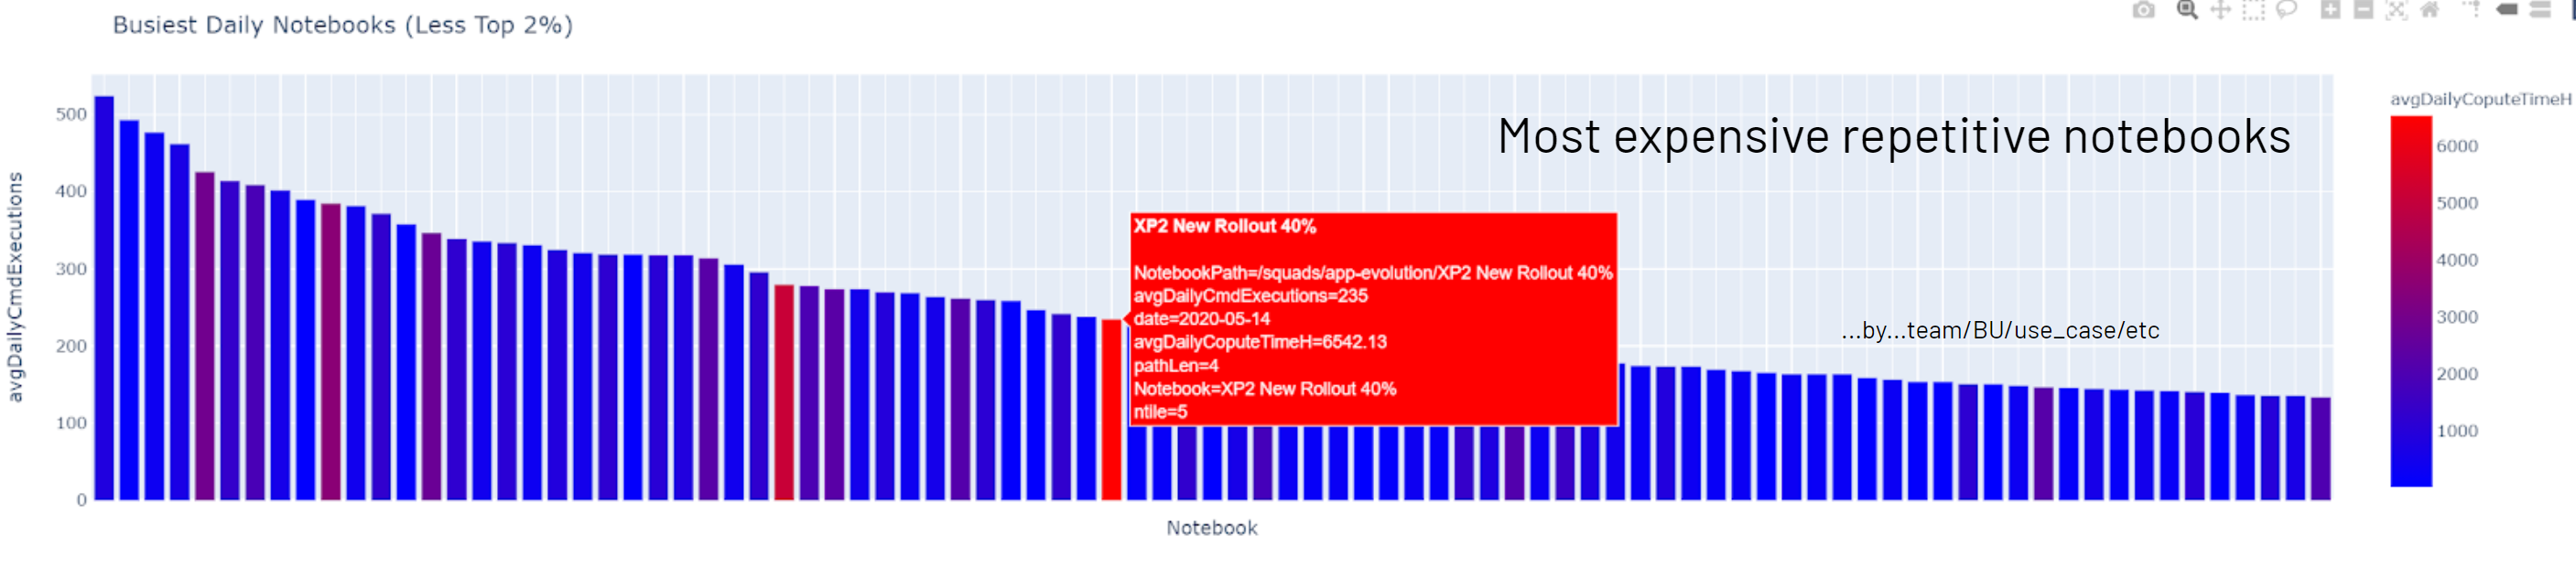 |
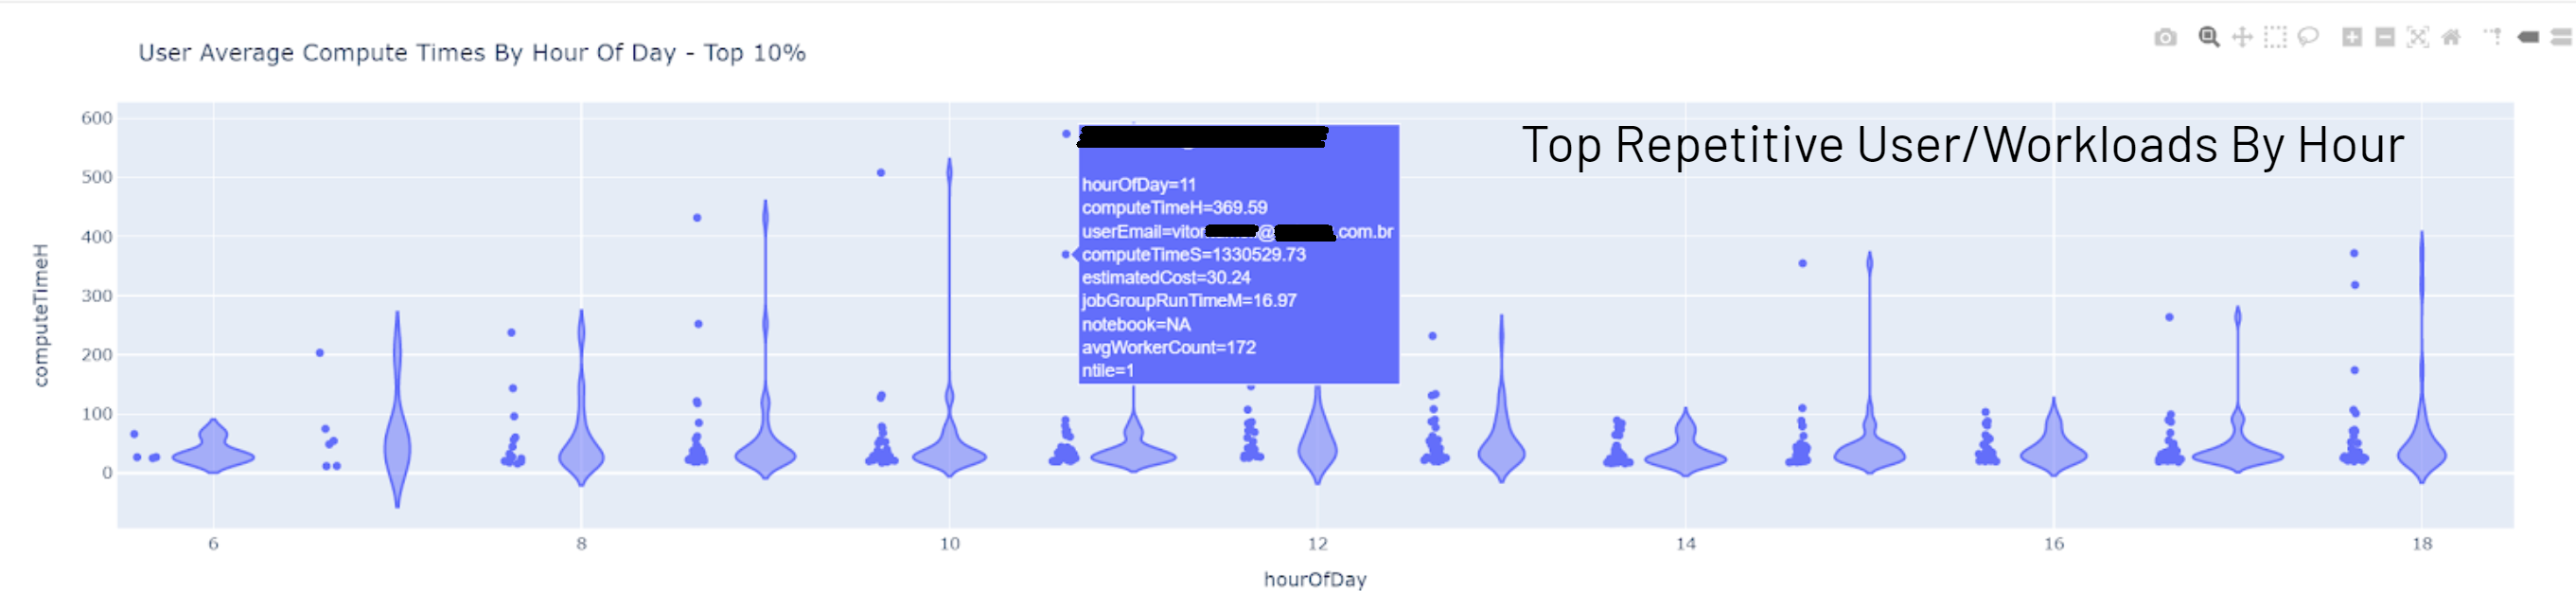 |
You can also use some of the Overwatch data to enrich real time Spark monitoring data. In order to see how to do this, please refer to the information here
Data Process Flow