Data Dictionary - 0.6.1.x
Consumption Layer “Tables” (Views)
All end users should be hitting consumer tables first. Digging into lower layers gets significantly more complex. Below is the data model for the consumption layer. The consumption layer is often in a stand-alone database apart from the ETL tables to minimize clutter and confusion. These entities in this layer are actually not tables at all (with a few minor exceptions such as lookup tables) but rather views. This allows for the Overwatch development team to alter the underlying columns, names, types, and structures without breaking existing transformations. Instead, view column names will remain the same but may be repointed to a newer version of a column, etc.
ETL should not be developed atop the consumption layer views but rather the gold layer. Before Overwatch version upgrades, it’s important that the engineering team review the change list and upgrade requirements before upgrading. These upgrades may require a remap depending on the changes. As of version 1.0 release, all columns in the gold layer will be underscored with their schema version number, column changes will reference the later release version but the views published with Overwatch will almost always point to the latest version of each column and will not include the schema suffix to simplify the data model for the average consumer.
Data Organization
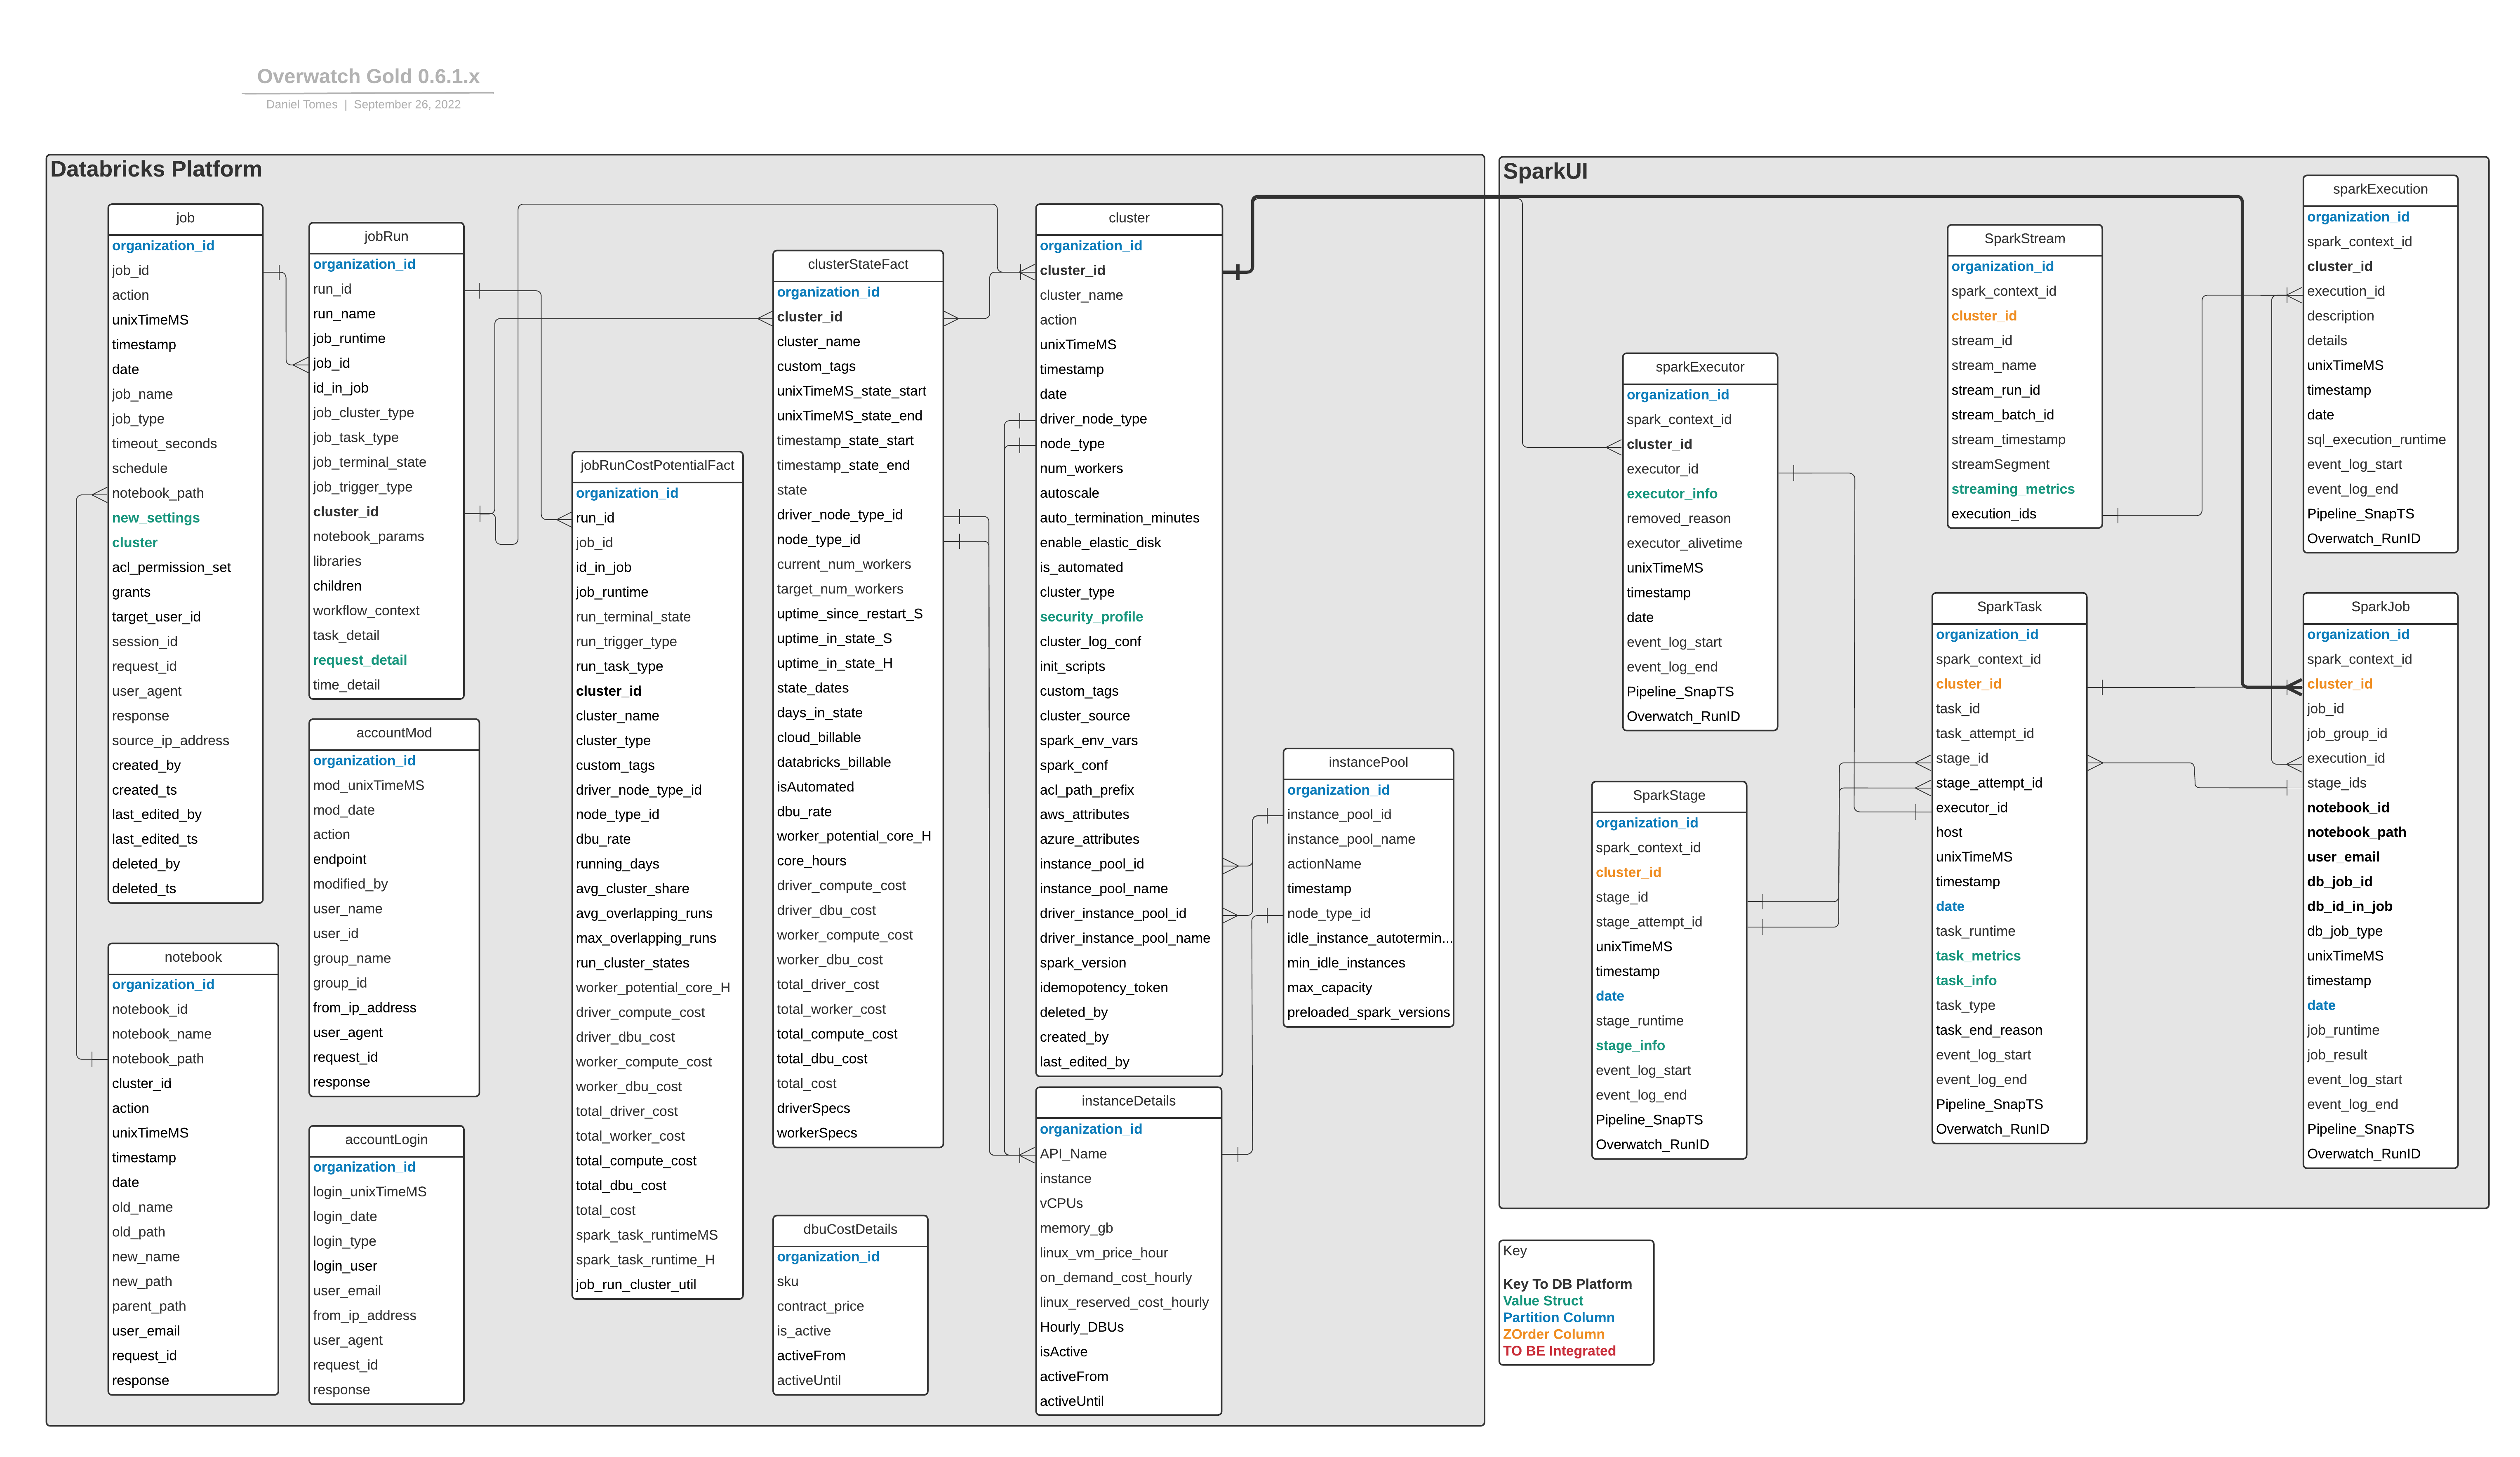
The large gray boxes in the simplified ERD below depict the two major, logical sections of the data model:
- Databricks Platform - Metadata captured by the Databricks platform that can be used to assist in workspace governance. This data can also be enriched with the Spark data enabling in-depth analyses. The breadth of metadata is continuing to grow, stay tuned for additional capabilities.
- Spark UI The spark UI section is derived from the spark event logs and essentially contains every single piece of data from the Spark UI. There are a few sections that are not included in the first release but the data is present in spark_events_bronze albeit extremely complex to derive. The Overwatch development team is working tirelessly to expose additional SparkUI data and will publish as soon as it’s ready.
Column Descriptions
Complete column descriptions are only provided for the consumption layer. The entity names are linked below.
- cluster
- clusterStateFact
- instanceDetails
- job
- jobrun
- jobRunCostPotentialFact
- notebook
- instancePool
- dbuCostDetail
- accountLogin
- accountMod
- sparkExecution
- sparkExecutor
- sparkJob
- sparkStage
- sparkTask
- sparkStream **preview
- Common Meta Fields
- There are several fields that are present in all tables. Instead of cluttering each table with them, this section was created as a reference to each of these.
Most tables below provide a data SAMPLE for reference. You may either click to view it or right click the SAMPLE link and click saveTargetAs or saveLinkAs and save the file. Note that these files are TAB delimited, so you will need to view as such if you save to local file. The data in the files were generated from an Azure, test deployment created by Overwatch Developers.
Cluster
KEY – organization_id + cluster_id + unixTimeMS
Incremental Columns – unixTimeMS
Partition Columns – organization_id
Write Mode – Append
| Column | Type | Description |
|---|---|---|
| cluster_id | string | Canonical Databricks cluster ID (more info in Common Meta Fields) |
| action | string | create, edit, or snapImpute – depicts the type of action for the cluster – **snapImpute is used on first run to initialize the state of the cluster even if it wasn’t created/edited since audit logs began |
| timestamp | timestamp | timestamp the action took place |
| cluster_name | string | user-defined name of the cluster |
| driver_node_type | string | Canonical name of the driver node type. |
| node_type | string | Canonical name of the worker node type. |
| num_workers | int | The number of workers defined WHEN autoscaling is disabled |
| autoscale | struct | The min/max workers defined WHEN autoscaling is enabled |
| auto_termination_minutes | int | The number of minutes before the cluster auto-terminates due to inactivity |
| enable_elastic_disk | boolean | Whether autoscaling disk was enabled or not |
| is_automated | booelan | Whether the cluster is automated (true if automated false if interactive) |
| cluster_type | string | Type of cluster (i.e. Serverless, SQL Analytics, Single Node, Standard) |
| security_profile | struct | Complex type to describe secrity features enabled on the cluster. More information Below |
| cluster_log_conf | string | Logging directory if configured |
| init_script | array | Array of init scripts |
| custom_tags | string | User-Defined tags AND also includes Databricks JobID and Databricks RunName when the cluster is created by a Databricks Job as an automated cluster. Other Databricks services that create clusters also store unique information here such as SqlEndpointID when a cluster is created by “SqlAnalytics” |
| cluster_source | string | Shows the source of the action **(TODO – checking on why null scenario with BUI) |
| spark_env_vars | string | Spark environment variables defined on the cluster |
| spark_conf | string | custom spark configuration on the cluster that deviate from default |
| acl_path_prefix | string | Automated jobs pass acl to clusters via a path format, the path is defined here |
| instance_pool_id | string | Canononical pool id from which workers receive nodes |
| driver_instance_pool_id | string | Canononical pool id from which driver receives node |
| instance_pool_name | string | Name of pool from which workers receive nodes |
| driver_instance_pool_name | string | Name of pool from which driver receives node |
| spark_version | string | DBR version - scala version |
| idempotency_token | string | Idempotent jobs token if used |
ClusterStateFact
KEY – organization_id + cluster_id + state + unixTimeMS_state_start
Incremental Columns – state_start_date + unixTimeMS
Partition Columns – organization_id + state_start_date
Z-Order Columns – cluster_id + unixTimeMS_state_start
Write Mode – Merge
Costs and state details by cluster at every state in the cluster lifecycle.
NOTE This fact table is not normalized on time. Some states will span multiple days and must be smoothed across days (i.e. divide by days_in_state) when trying to calculate costs by day. All states are force-terminated at the end of the Overwatch run to the until-timestamp of the run. If the state was still active at this time, it will be updated on the subsequent run.
| Column | Type | Description |
|---|---|---|
| cluster_id | string | Canonical Databricks cluster ID (more info in Common Meta Fields) |
| cluster_name | string | Name of cluster at beginning of state |
| custom_tags | string | JSON string of key/value pairs for all cluster associated custom tags give to the cluster |
| *_state_start | various | timestamp reference column at the time the state began |
| *_state_end | various | timestamp reference column at the time the state ended |
| state | string | state of the cluster – full list HERE |
| current_num_workers | long | number of workers in use by the cluster at the start of the state |
| target_num_worers | long | number of workers targeted to be present by the completion of the state. Should be equal to current_num_workers except during RESIZING state |
| uptime_since_restart_S | double | Seconds since the cluster was last restarted / terminated |
| uptime_in_state_S | double | Seconds the cluster spent in current state |
| uptime_in_state_H | double | Hours the cluster spent in current state |
| driver_node_type_id | string | KEY of driver node type to enable join to instanceDetails |
| node_type_id | string | KEY of worker node type to enable join to instanceDetails |
| cloud_billable | boolean | All current known states are cloud billable. This means that cloud provider charges are present during this state |
| databricks_billable | boolean | State incurs databricks DBU costs. All states incur DBU costs except: INIT_SCRIPTS_FINISHED, INIT_SCRIPTS_STARTED, STARTING, TERMINATING, CREATING, RESTARTING |
| isAutomated | boolean | Whether the cluster was created as an “automated” or “interactive” cluster |
| dbu_rate | double | Effective dbu rate used for calculations (effective at time of pipeline run) |
| state_dates | array | Array of all dates across which the state spanned |
| days_in_state | int | Number of days in state |
| worker_potential_core_H | double | Worker core hours available to execute spark tasks |
| core_hours | double | All core hours of entire cluster (including driver). Nodes * cores * hours in state |
| driver_compute_cost | double | Compute costs associated with driver runtime |
| driver_dbu_cost | double | DBU costs associated with driver runtime |
| worker_compute_cost | double | Compute costs associated with worker runtime |
| worker_dbu_cost | double | DBU costs associated with cumulative runtime of all worker nodes |
| total_driver_cost | double | Driver costs including DBUs and compute |
| total_worker_cost | double | Worker costs including DBUs and compute |
| total_compute_cost | double | All compute costs for Driver and Workers |
| total_dbu_cost | double | All dbu costs for Driver and Workers |
| total_cost | double | Total cost from Compute and DBUs for all nodes (including Driver) |
| driverSpecs | struct | Driver node details |
| workerSpecs | struct | Worker node details |
Cost Functions Explained
EXPECTATIONS – Note that Overwatch costs are derived. This is good and bad. Good as it allows for costs to be broken down by any dimension at the millisecond level. Bad because there can be significant differences between the derived costs and actual costs. These should generally be very close to equal but may differ within margin of error by as much as 10%. To verify the cost functions and the elements therein feel free to review them in more detail. If your costs are off by a large marine, please review all the components of the cost function and correct any configurations as necessary to align your reality with the Overwatch config. The default costs are list price and often do not accurately reflect a customer’s costs.
- driver_compute_cost: when cloudBillable –> Driver Node Compute Contract Price Hourly (instanceDetails) * Uptime_In_State_H –> otherwise 0
- worker_compute_cost: when cloudBillable –> Worker Node Compute Contract Price Hourly (instanceDetails) * Uptime_In_State_H * target_num_workers –> otherwise 0
- target_num_workers used here is ambiguous. Assuming all targeted workers can be provisioned, the calculation is most accurate; however, if some workers cannot be provisioned the worker_compute_cost will be slightly higher than actual while target_num_workers > current_num_workers. target_num_workers used here because the compute costs begin accumulating as soon as the node is provisioned, not at the time it is added to the cluster.
- driver_dbu_cost: when databricks_billable –> driver_hourly_dbus (instancedetails.hourlyDBUs) * houry_dbu_rate for dbu type (dbuCostDetails.contract_price) * uptime_in_state_H –> otherwise 0
- worker_dbu_cost: when databricks_billable –> driver_hourly_dbus (instancedetails.hourlyDBUs) * houry_dbu_rate for dbu type (dbuCostDetails.contract_price) *
current_num_workers * uptime_in_state_H –> otherwise 0
- current_num_workers used here as dbu costs do not begin until the node able to receive workloads (i.e. node is moved from target_worker to current_worker / “upsize_complete” state)
- cloudBillable: Cluster is in a running state
- GAP: Note that cloud billable ends at the time the cluster is terminated even though the nodes remain provisioned in the cloud provider for several more minutes; these additional minutes are not accounted for in this cost function.
InstanceDetails
KEY – Organization_ID + API_name
Incremental Columns – Pipeline_SnapTS
Partition Columns – organization_id
Write Mode – Append
This table is unique and it’s purpose is to enable users to identify node specific contract costs associated with Databricks and the Cloud Provider through time. Defaults are loaded as an example by workspace. These defaults are meant to be reasonable, not accurate by default as there is a wide difference between cloud discount rates and prices between regions / countries. Everytime Overwatch runs, it validates the presence of this table and whether it has any data present for the current workspace, if it does not it creates and appends the relevant data to it; otherwise no action is taken. This gives the user the ability to extend / customize this table to fit their needs by workspace. Each organization_id (workspace), should provide complete cost data for each node used in that workspace. If you decide to completely customize the table, it’s critical to note that some columns are required for the ETL to function; these fields are indicated below in the table with an asterisk.
The organization_id (i.e. workspace id) is automatically generated for each workspace if that organization_id is not present in the table already (or the table is not present at all). Each workspace (i.e. organization_id) often has unique costs, this table enables you to customize compute pricing.
IMPORTANT This table must be configured such that there are no overlapping costs (by time) and no gaps (by time) in costs for any key (organization_id + API_name) between primordial date and current date. This means that for a record to be “expired” the following must be true:
- original key expired by setting activeUntil == expiry date
- original key must be created with updated information and must:
- have activeFrom == expiry date of previous record (no gap, no overlap)
- have activeUntil == lit(null).cast(“date”)
| Column | Type | Description |
|---|---|---|
| instance | string | Common name of instance type |
| API_name* | string | Canonical KEY name of the node type – use this to join to node_ids elsewhere |
| vCPUs* | int | Number of virtual cpus provisioned for the node type |
| Memory_GB | double | Gigabyes of memory provisioned for the node type |
| Compute_Contract_Price* | double | Contract price for the instance type as negotiated between customer and cloud vendor. This is the value used in cost functions to deliver cost estimates. It is defaulted to equal the on_demand compute price |
| On_Demand_Cost_Hourly | double | On demand, list price for node type DISCLAIMER – cloud provider pricing is dynamic and this is meant as an initial reference. This value should be validated and updated to reflect actual pricing |
| Linux_Reserved_Cost_Hourly | double | Reserved, list price for node type DISCLAIMER – cloud provider pricing is dynamic and this is meant as an initial reference. This value should be validated and updated to reflect actual pricing |
| Hourly_DBUs* | double | Number of DBUs charged for the node type |
| is_active | boolean | whether the contract price is currently active. This must be true for each key where activeUntil is null |
| activeFrom* | date | The start date for the costs in this record. NOTE this MUST be equal to one other record’s activeUntil unless this is the first record for these costs. There may be no overlap in time or gaps in time. |
| activeUntil* | date | The end date for the costs in this record. Must be null to indicate the active record. Only one record can be active at all times. The key (API_name) must have zero gaps and zero overlaps from the Overwatch primordial date until now indicated by null (active) |
dbuCostDetails
KEY – Organization_ID + sku
Incremental Columns – activeFrom
Partition Columns – organization_id
Write Mode – Append
Slow-changing dimension to track DBU contract costs by workspace through time. This table should only need to be edited in very rare circumstances such as historical cost correction. Note that editing these contract prices will not retroactively modify historical pricing in the costing table such as clusterStateFact or jobRunCostPotentialFact. For prices to be recalculated, the gold pipeline modules must be rolled back properly such that the costs can be rebuilt with the updated values.
| Column | Type | Description |
|---|---|---|
| sku | string | One of automated, interactive, jobsLight, sqlCompute |
| contract_price | double | Price paid per DBU on the sku |
| is_active | boolean | whether the contract price is currently active. This must be true for each key where activeUntil is null |
| activeFrom* | date | The start date for the costs in this record. NOTE this MUST be equal to one other record’s activeUntil unless this is the first record for these costs. There may be no overlap in time or gaps in time. |
| activeUntil* | date | The end date for the costs in this record. Must be null to indicate the active record. Only one record can be active at all times. The key (API_name) must have zero gaps and zero overlaps from the Overwatch primordial date until now indicated by null (active) |
Job
KEY – organization_id + job_id + unixTimeMS + action + request_id
Incremental Columns – unixTimeMS
Partition Columns – organization_id
Write Mode – Append
| Column | Type | Description |
|---|---|---|
| organization_id | string | Canonical workspace id |
| job_id | string | Databricks job id |
| action | string | Action type defined by the record. One of: create, reset, update, delete, resetJobAcl, changeJobAcl. More information about these actions can be found here |
| timestamp | timestamp | timestamp the action took place |
| job_name | string | User defined name of job. NOTE, all jobs created through the UI are initialized with the name, “Untitled” therefore UI-created-named jobs will have an edit action to set the name. The cluster is also set to automated and defaulted on UI create as well |
| job_type | string | ?? TBD ?? – there is a job_task_type but that’s in Run_id |
| timeout_seconds | string | null unless specified, default == null. Timeout seconds specified in UI or via api |
| schedule | string | JSON - quartz cron expression of scheduled job and timezone_id |
| notebook_path | string | null if job task does not point to a notebook task. If job points to notebook for execution, this is path to that notebook |
| new_settings | dynamic struct | job action with “reset” or “update” where settings were changed. Includes complex type of cluster. JobSettings Structure Found Here |
| cluster | dyanmic struct | Where relevant, contains the “new_cluster” spec when cluster definition is “new_cluster” or automated. If job definition points to existing cluster the cluster_id can be found here |
| aclPermissionSet | string | Predefined aclPermissionsSet such as “Admin” or “Owner”. More information on these can be found HERE |
| grants | string JSON | Array of explicit grants given to explicit user list |
| target_user_id | string | Databricks canonical user id to which the aclPermissionSet is to be applied |
| session_id | string | session_id that requested the action |
| request_id | string | request_id of the action |
| user_agent | string | request origin such as browser, terraform, api, etc. |
| response | struct | response of api call including errorMessage, result, and statusCode (HTTP 200,400, etc) |
| source_ip_address | string | Origin IP of action requested |
JobRun
KEY – organization_id + run_id + startEpochMS
Incremental Columns – startEpochMS
Partition Columns – organization_id
Write Mode – Merge
Inventory of every canonical job run executed in a databricks workspace.
| Column | Type | Description |
|---|---|---|
| organization_id | string | Canonical workspace id |
| run_id | int | Incremental Canonical run ID for the workspaced |
| run_name | string | Name of run (if named) |
| job_runtime | struct | Complex type with all, standard, runtime information regarding the runtime of the job. The start begins from the moment the job run start is requested (including cluster create time if relevant) and the end time marks the moment the workspace identifies the run as terminated |
| job_id | int | Canonical ID of job |
| id_in_job | int | Run instance of the job_id. This can be seen in the UI in a job spec denoted as “Run N”. Each Job ID has first id_in_job as “Run 1” and is incrented and canonical ONLY for the job_id. This field omits the “Run " prefix and results in an integer value of run instance within job. |
| job_cluster_type | string | Either new OR existing. New == automated and existing == interactive cluster type |
| job_task_type | string | Job Task Type - such as Notebook, Python, etc. See JobTask |
| job_terminal_state | string | Result state of run such as SUCCESS, FAILED, TIMEDOUT, CANCELLED. See RunResultState |
| job_trigger_type | string | Type of trigger: PERIODIC, ONE_TIME, RETRY. See TriggerType |
| cluster_id | string | Canonical workspace cluster id |
| notebook_params | string JSON | A map of (String, String) parameters sent to notebook parameter overrides. See ParamPair |
| libraries | string JSON | Array of Libraries in the format defined HERE |
| children | array | Array of structs that show all children of this job |
| workflow_context | string | ?? REVIEW ?? |
| task_detail | struct | Unified location for JobTask contingent upon jobrun task. See JobTask |
| cancellation_detail | struct | All cancellation request detail and status |
| time_detail | struct | All time dimensions tied to the run. runBeginTime == Time the run began to execute on the cluster, SubmissionTime == Time the run request was received by the endpoint (before cluster build/start), completionTime == time the workspace denoted the runID was terminal state |
| started_by | struct | Run request received from user – email is recorded here – usage == started_by.email |
| request_detail | struct | Complete request detail received by the endpoint |
JobRunCostPotentialFact
KEY – organization_id + run_id + startEpochMS
Incremental Columns – startEpochMS
Partition Columns – organization_id
Write Mode – Merge
This fact table defines the job, the cluster, the cost, the potential, and utilization (if cluster logging is enabled) of a cluster associated with a specific Databricks Job Run.
Dimensionality Note that this fact table is not normalized by time but rather by job run and cluster state. Costs are not derived from job runs but from clusters thus the state[s] of the cluster are what’s pertinent when tying to cost. This is extremely important in the case of long running jobs, such as streaming.
SCENARIO: Imagine a streaming job with 12 concurrent runs on an existing cluster that run for 20 days at the end of which the driver dies for some reason causing all runs fail and begin retrying but failing. When the 20 days end, the cost will be captured solely on that date and even more importantly, not only will all 20 days be captured at that date but the cost associated will be cluster runtime for 20 days * number of runs. Overwatch will automatically smooth the costs across the concurrent runs but not the days running since this fact table is not based by on an equidistant time axis.
- Potential: Total core_milliseconds for which the cluster COULD execute spark tasks. This derivation only includes the worker nodes in a state ready to receive spark tasks (i.e. Running). Nodes being added or running init scripts are not ready for spark jobs thus those core milliseconds are omitted from the total potential.
- Cost: Derived from the instanceDetails table and DBU configured contract price (see Configuration for more details). The compute costs in instanceDetails table are taken from the “Compute_Contract_Price” values associated with the instance type in instanceDetails.
- Utilization: Utilization is a function of core milliseconds used during spark task execution divided by the total amount of core milliseconds available given the cluster size and state. (i.e. spark_task_runtime_H / worker_potential_core_H)
- Cluster State: The state[s] of a cluster during a run. As the cluster scales and morphs to accommodate the run’s needs, the state changes. The number of state changes are recorded in this table as “run_cluster_states”.
- Run State: Advanced Topic for data engineers and developers. This topic is discussed in considerable detail in the Advanced Topics section. Given a cluster state, the run state is a state of all runs on a cluster at a given moment in time. This is the measure used to calculate shared costs across concurrent runs. A run state cannot pass the boundaries of a cluster state, a run that continues across cluster-state lines will result in a new run state.
| Column | Type | Description |
|---|---|---|
| organization_id | string | Canonical workspace id |
| job_id | long | Canonical ID of job |
| id_in_job | long | Run instance of the job_id. This can be seen in the UI in a job spec denoted as “Run N”. Each Job ID has first id_in_job as “Run 1” and is incrented and canonical ONLY for the job_id. This field omits the “Run " prefix and results in an integer value of run instance within job. |
| job_runtime | struct | Time details of job start/end in epoch millis and timestamps |
| cluster_id | string | Canonical workspace cluster id |
| cluster_name | string | Name of cluster at time of run |
| cluster_type | string | Either new OR existing. New == automated and existing == interactive cluster type |
| custom_tags | string | JSON string of key/value pairs for all cluster associated custom tags give to the cluster |
| run_terminal_state | string | Final state of the job such as “Succeeded”, “Failed” or “Cancelled” |
| run_trigger_type | string | How the run was triggered (i.e. cron / manual) |
| run_task_type | string | Type of task in the job (i.e. notebook, jar, spark-submit, etc.) |
| driver_node_type_id | string | KEY of driver node type to enable join to instanceDetails |
| node_type_id | string | KEY of worker node type to enable join to instanceDetails |
| dbu_rate | double | Effective DBU rate at time of job run used for calculations based on configured contract price in instanceDetails at the time of the Overwatch Pipeline Run |
| running_days | array | Array (or list) of dates (not strings) across which the job run executed. This simplifies day-level cost attribution, among other metrics, when trying to smooth costs for long-running / streaming jobs |
| avg_cluster_share | double | Average share of the cluster the run had available assuming fair scheduling. This DOES NOT account for activity outside of jobs (i.e. interactive notebooks running alongside job runs), this measure only splits out the share among concurrent job runs. Measure is only calculated for interactive clusters, automated clusters assume 100% run allocation. For more granular utilization detail, enable cluster logging and utilize “job_run_cluster_util” column which derives utilization at the spark task level. |
| avg_overlapping_runs | double | Number of concurrent runs shared by the cluster on average throughout the run |
| max_overlapping_runs | long | Highest number of concurrent runs on the cluster during the run |
| run_cluster_states | long | Count of cluster states during the job run |
| worker_potential_core_H | double | cluster core hours capable of executing spark tasks, “potential” |
| driver_compute_cost | double | Compute costs associated with driver runtime |
| driver_dbu_cost | double | DBU costs associated with driver runtime |
| worker_compute_cost | double | Compute costs associated with worker runtime |
| worker_dbu_cost | double | DBU costs associated with cumulative runtime of all worker nodes |
| total_driver_cost | double | Driver costs including DBUs and compute |
| total_worker_cost | double | Worker costs including DBUs and compute |
| total_compute_cost | double | All compute costs for Driver and Workers |
| total_dbu_cost | double | All dbu costs for Driver and Workers |
| total_cost | double | Total cost from Compute and DBUs for all nodes (including Driver) |
| spark_task_runtimeMS | long | Spark core execution time in milliseconds (i.e. task was operating/locking on core) |
| spark_task_runtime_H | double | Spark core execution time in Hours (i.e. task was operating/locking on core) |
| job_run_cluster_util | double | Cluster utilization: spark task execution time / cluster potential. True measure by core of utilization. Only available when cluster logging is enabled. |
Notebook
KEY – organization_id + notebook_id + request_id + action + unixTimeMS
Incremental Columns – unixTimeMS
Partition Columns – organization_id
Write Mode – Append
| Column | Type | Description |
|---|---|---|
| notebook_id | string | Canonical notebook id |
| notebook_name | string | Name of notebook at time of action requested |
| notebook_path | string | Path of notebook at time of action requested |
| cluster_id | string | Canonical workspace cluster id |
| action | string | action recorded |
| timestamp | timestamp | timestamp the action took place |
| old_name | string | When action is “renameNotebook” this holds notebook name before rename |
| old_path | string | When action is “moveNotebook” this holds notebook path before move |
| new_name | string | When action is “renameNotebook” this holds notebook name after rename |
| new_path | string | When action is “moveNotebook” this holds notebook path after move |
| parent_path | string | When action is “renameNotebook” notebook containing, workspace path is recorded here |
| user_email | string | Email of the user requesting the action |
| request_id | string | Canonical request_id |
| response | struct | HTTP response including errorMessage, result, and statusCode |
InstancePool
KEY – organization_id + instance_pool_id + timestamp
Incremental Columns – timestamp
Partition Columns – organization_id
Write Mode – Merge
| Column | Type | Description |
|---|---|---|
| instance_pool_id | string | Canonical notebook id |
| instance_pool_name | string | Name of notebook at time of action requested |
| actionName | string | action recorded |
| timestamp | long | timestamp the action took place |
| node_type_id | string | Type of node in the pool |
| idle_instance_autotermination_minutes | long | Minutes after which a node shall be terminated if unused |
| min_idle_instances | long | Minimum number of hot instances in the pool |
| max_capacity | long | Maximum number of nodes allowed in the pool |
| preloaded_spark_versions | string | Spark versions preloaded on nodes in the pool |
Account Tables
Not exposed in the consumer database. These tables contain more sensitive information and by default are not exposed in the consumer database but held back in the ETL database. This is done purposely to simplify security when/if desired. If desired, this can be exposed in consumer database with a simple vew definition exposing the columns desired.
For deeper insights regarding audit, please reference auditLogSchema. This is simplified through the use of the ETL_DB.audit_log_bronze and filter where serviceName == accounts for example. Additionally, you may filter down to specific actions using “actionName”. An example query is provided below:
spark.table("overwatch.audit_log_bronze")
  .filter('serviceName === "accounts" && 'actionName === "createGroup")
  .selectExpr("*", "requestParams.*").drop("requestParams")
Slow changing dimension of user entity through time. Also used as reference map from user_email to user_id
| Column | Type | Description |
|---|---|---|
| organization_id | string | Canonical workspace id |
| user_id | string | Canonical user id for which the action was requested (within the workspace) (target) |
| user_email | string | User’s email for which the action was requested (target) |
| action | string | Action requested to be performed |
| added_from_ip_address | string | Source IP of the request |
| added_by | string | Authenticated user that made the request |
| user_agent | string | request origin such as browser, terraform, api, etc. |
AccountMod
KEY – organization_id + acton + mod_unixTimeMS + request_id
Incremental Columns – mod_unixTimeMS
Partition Columns – organization_id
Write Mode – Append
TODO
AccountLogin
KEY – organization_id + login_type + login_unixTimeMS + from_ip_address
Incremental Columns – login_unixTimeMS
Partition Columns – organization_id
Write Mode – Append
Not exposed in the consumer database. This table contains more sensitive information and by default is not exposed in the consumer database but held back in the etl datbase. This is done purposely to simplify security when/if desired. If desired, this can be exposed in consumer database with a simple vew definition exposing the columns desired.
| Column | Type | Description |
|---|---|---|
| user_id | string | Canonical user id (within the workspace) |
| user_email | string | User’s email |
| login_type | string | Type of login such as web, ssh, token |
| ssh_username | string | username used to login via SSH |
| groups_user_name | string | ?? To research ?? |
| account_admin_userID | string | ?? To research ?? |
| login_from_ip_address | struct | Details about the source login and target logged into |
| user_agent | string | request origin such as browser, terraform, api, etc. |
The following sections are related to Spark. Everything that can be seend/found in the SparkUI is visibel in the spark tables below. A reasonable understanding of the Spark hierarchy is necessary to make this section simpler. Please reference Spark Hierarchy For More Details for more details.
SparkExecution
KEY – organization_id + spark_context_id + execution_id + date + unixTimeMS
Incremental Columns – date + unixTimeMS
Partition Columns – organization_id
Write Mode – Merge
| Column | Type | Description |
|---|---|---|
| organization_id | string | Canonical workspace id |
| spark_context_id | string | Canonical context ID – One Spark Context per Cluster |
| cluster_id | string | Canonical workspace cluster id |
| execution_id | long | Spark Execution ID |
| description | string | Description provided by spark |
| details | string | Execution StackTrace |
| sql_execution_runtime | struct | Complete runtime detail breakdown |
SparkExecutor
KEY – organization_id + spark_context_id + executor_id + date + unixTimeMS
Incremental Columns – date + unixTimeMS
Partition Columns – organization_id
Write Mode – Merge
| Column | Type | Description |
|---|---|---|
| organization_id | string | Canonical workspace id |
| spark_context_id | string | Canonical context ID – One Spark Context per Cluster |
| cluster_id | string | Canonical workspace cluster id |
| executor_id | int | Executor ID |
| executor_info | string | Executor Detail |
| removed_reason | string | Reason executor was removed |
| executor_alivetime | struct | Complete lifetime detail breakdown |
SparkJob
KEY – organization_id + spark_context_id + job_id + unixTimeMS
Incremental Columns – date + unixTimeMS
Partition Columns – organization_id + date
Z-Order Columns – cluster_id
Write Mode – Merge
| Column | Type | Description |
|---|---|---|
| organization_id | string | Canonical workspace id |
| spark_context_id | string | Canonical context ID – One Spark Context per Cluster |
| cluster_id | string | Canonical workspace cluster id |
| job_id | string | Spark Job ID |
| job_group_id | string | Spark Job Group ID – NOTE very powerful for many reasons. See SparkEvents |
| execution_id | string | Spark Execution ID |
| stage_ids | array[long] | Array of all Spark Stage IDs nested within this Spark Job |
| notebook_id | string | Canonical Databricks Workspace Notebook ID |
| notebook_path | string | Databricks Notebook Path |
| user_email | string | email of user that owned the request, for Databricks jobs this will be the job owner |
| db_job_id | string | Databricks Job Id executing the Spark Job |
| db_id_in_job | string | “id_in_job” such as “Run 10” without “Run " prefix. This is a critical join column when working looking up Databricks Jobs metadata |
| job_runtime | string | Complete job runtime detail breakdown |
| job_result | struct | Job Result and Exception if present |
SparkStage
KEY – organization_id + spark_context_id + stage_id + stage_attempt_id + unixTimeMS
Incremental Columns – date + unixTimeMS
Partition Columns – organization_id + date
Z-Order Columns – cluster_id
Write Mode – Merge
| Column | Type | Description |
|---|---|---|
| organization_id | string | Canonical workspace id |
| spark_context_id | string | Canonical context ID – One Spark Context per Cluster |
| cluster_id | string | Canonical workspace cluster id |
| stage_id | string | Spark Stage ID |
| stage_attempt_id | string | Spark Stage Attempt ID |
| stage_runtime | string | Complete stage runtime detail |
| stage_info | string | Lineage of all accumulables for the Spark Stage |
SparkTask
KEY – organization_id + spark_context_id + task_id + task_attempt_id + stage_id + stage_attempt_id + host + unixTimeMS
Incremental Columns – date + unixTimeMS
Partition Columns – organization_id + date
Z-Order Columns – cluster_id
Write Mode – Merge
USE THE PARTITION COLUMN (date) and Indexed Column (cluster_id) in all joins and filters where possible. This table can get extremely large, select samples or smaller date ranges and reduce joins and columns selected to improve performance.
| Column | Type | Description |
|---|---|---|
| organization_id | string | Canonical workspace id |
| workspace_name | string | Customizable human-legible name of the workspace, should be globally unique within the organization |
| spark_context_id | string | Canonical context ID – One Spark Context per Cluster |
| cluster_id | string | Canonical workspace cluster id |
| task_id | string | Spark Task ID |
| task_attempt_id | string | Spark Task Attempt ID |
| stage_id | string | Spark Stage ID |
| stage_attempt_id | string | Spark Stage Attempt ID |
| executor_id | string | Spark Executor ID |
| host | string | Internal IP address of node |
| task_runtime | string | Complete task runtime detail |
| task_metrics | string | Lowest level compute metrics provided by spark such as spill bytes, read/write bytes, shuffle info, GC time, Serialization, etc. |
| task_info | string | Lineage of all accumulables for the Spark Task |
| task_type | string | Spark task Type (i.e. ResultTask, ShuffleMapTask, etc) |
| task_end_reason | string | Task end status, state, and details plus stake trace when error |
SparkStream_preview
KEY – organization_id + spark_context_id + cluster_id + stream_id + stream_run_id + stream_batch_id + stream_timestamp
Incremental Columns – date + stream_timestamp
Partition Columns – organization_id + date
Z-Order Columns – cluster_id
Write Mode – Merge
Remains in preview through version 0.6.0 as more feedback is requested from users and use-cases before this table structure solidifes.
| Column | Type | Description |
|---|---|---|
| spark_context_id | string | Canonical context ID – One Spark Context per Cluster |
| cluster_id | string | Canonical workspace cluster id |
| stream_id | string | GUID ID of the spark stream |
| stream_name | string | Name of stream if named |
| stream_run_id | string | GUID ID of the spark stream run |
| stream_batch_id | long | GUID ID of the spark stream run batch |
| stream_timestamp | long | Unix time (millis) the stream reported its batch complete metrics |
| streamSegment | string | Type of event from the event listener such as ‘Progressed’ |
| streaming_metrics | dynamic struct | All metrics available for the stream batch run |
| execution_ids | array | Array of execution_ids in the spark_context. Can explode and tie back to sparkExecution and other spark tables |
Common Meta Fields
| Column | Type | Description |
|---|---|---|
| organization_id | string | Workspace / Organization ID on which the cluster was instantiated |
| cluster_id | string | Canonical workspace cluster id |
| unixTimeMS | long | unix time epoch as a long in milliseconds |
| timestamp | string | unixTimeMS as a timestamp type in milliseconds |
| date | string | unixTimeMS as a date type |
| created_by | string | |
| last_edited_by | string | last user to edit the state of the entity |
| last_edited_ts | string | timestamp at which the entitiy’s sated was last edited |
| deleted_by | string | user that deleted the entity |
| deleted_ts | string | timestamp at which the entity was deleted |
| event_log_start | string | Spark Event Log BEGIN file name / path |
| event_log_end | string | Spark Event Log END file name / path |
| Pipeline_SnapTS | string | Snapshot timestmap of Overwatch run that added the record |
| Overwatch_RunID | string | Overwatch canonical ID that resulted in the record load |
ETL Tables
The following are the list of potential tables, the module with which it’s created and the layer in which it lives. This list consists of only the ETL tables created to facilitate and deliver the consumption layer The gold and consumption layers are the only layers that maintain column name uniformity and naming convention across all tables. Users should always reference Consumption and Gold layers unless the data necessary has not been curated.
Bronze
| Table | Scope | Layer | Description |
|---|---|---|---|
| audit_log_bronze | audit | bronze | Raw audit log data full schema |
| audit_log_raw_events | audit | bronze (azure) | Intermediate staging table responsible for coordinating intermediate events from azure Event Hub |
| cluster_events_bronze | clusterEvents | bronze | Raw landing of dataframe derived from JSON response from cluster events api call. Note: cluster events expire after 30 days of last termination. (reference) |
| clusters_snapshot_bronze | clusters | bronze | API snapshot of existing clusters defined in Databricks workspace at the time of the Overwatch run. Snapshot is taken on each run |
| jobs_snapshot_bronze | jobs | bronze | API snapshot of existing jobs defined in Databricks workspace at the time of the Overwatch run. Snapshot is taken on each run |
| pools_snapshot_bronze | pools | bronze | API snapshot of existing pools defined in Databricks workspace at the time of the Overwatch run. Snapshot is taken on each run |
| spark_events_bronze | sparkEvents | bronze | Raw landing of the master sparkEvents schema and data for all cluster logs. Cluster log locations are defined by cluster specs and all locations will be scanned for new files not yet captured by Overwatch. Overwatch uses an implicit schema generation here, as such, a lack of real-world can cause unforeseen issues. |
| spark_events_processedfiles | sparkEvents | bronze | Table that keeps track of all previously processed cluster log files (spark event logs) to minimize future file scanning and improve performance. This table can be used to reprocess and/or find specific eventLog files. |
| pipeline_report | NA | tracking | Tracking table used to identify state and status of each Overwatch Pipeline run. This table is also used to control the start and end points of each run. Altering the timestamps and status of this table will change the ETL start/end points. |
Silver
| Table | Scope | Layer | Description |
|---|---|---|---|
| account_login_silver | accounts | silver | Login events |
| account_mods_silver | accounts | silver | Account modification events |
| cluster_spec_silver | clusters | silver | Slow changing dimension used to track all clusters through time including edits but excluding state change. |
| cluster_state_detail_silver | clusterEvents | silver | State detail for each cluster event enriched with cost information |
| job_status_silver | jobs | silver | Slow changing dimension used to track all jobs specifications through time |
| jobrun_silver | jobs | silver | Historical run of every job since Overwatch began capturing the audit_log_data |
| notebook_silver | notebooks | silver | Slow changing dimension used to track all notebook changes as it morphs through time along with which user instigated the change. This does not include specific change details of the commands within a notebook just metadata changes regarding the notebook. |
| pools_silver | pools | silver | Slow changing dimension used to track all changes to instance pools |
| spark_executions_silver | sparkEvents | silver | All spark event data relevant to spark executions |
| spark_executors_silver | sparkEvents | silver | All spark event data relevant to spark executors |
| spark_jobs_silver | sparkEvents | silver | All spark event data relevant to spark jobs |
| spark_stages_silver | sparkEvents | silver | All spark event data relevant to spark stages |
| spark_tasks_silver | sparkEvents | silver | All spark event data relevant to spark tasks |
Gold
| Table | Scope | Layer | Description |
|---|---|---|---|
| account_login_gold | accounts | gold | Login events |
| account_mods_gold | accounts | gold | Account modification events |
| cluster_gold | clusters | gold | Slow-changing dimension with all cluster creates and edits through time. These events DO NOT INCLUDE automated cluster resize events or cluster state changes. Automated cluster resize and cluster state changes will be in clusterstatefact_gold. If user changes min/max nodes or node count (non-autoscaling) the event will be registered here AND clusterstatefact_gold. |
| clusterStateFact_gold | clusterEvents | gold | All cluster event changes along with the time spent in each state and the core hours in each state. This table should be used to find cluster anomalies and/or calculate compute/DBU costs of some given scope. |
| job_gold | jobs | gold | Slow-changing dimension of all changes to a job definition through time |
| jobrun_gold | jobs | gold | Dimensional data for each job run in the databricks workspace |
| notebook_gold | notebooks | gold | Slow changing dimension used to track all notebook changes as it morphs through time along with which user instigated the change. This does not include specific change details of the commands within a notebook just metadata changes regarding the notebook. |
| instancepool_gold | pools | gold | Slow changing dimension used to track all changes to instance pools |
| sparkexecution_gold | sparkEvents | gold | All spark event data relevant to spark executions |
| sparkexecutor_gold | sparkEvents | gold | All spark event data relevant to spark executors |
| sparkjob_gold | sparkEvents | gold | All spark event data relevant to spark jobs |
| sparkstage_gold | sparkEvents | gold | All spark event data relevant to spark stages |
| sparktask_gold | sparkEvents | gold | All spark event data relevant to spark tasks |
| sparkstream_gold | sparkEvents | gold | All spark event data relevant to spark streams |