End-to-End Workflow
This guide covers the complete Lakemeter workflow from creating an estimate to interpreting the exported Excel report. Follow this when you need to produce a cost estimate for a customer proposal, internal planning exercise, or vendor comparison.
Video walkthrough
Full walkthrough: create an estimate, add workloads, configure compute and usage, review costs, and export the report.
Overview
Create Estimate → Add Workloads → Configure Each Workload → Review Costs → Export Excel → Interpret Report
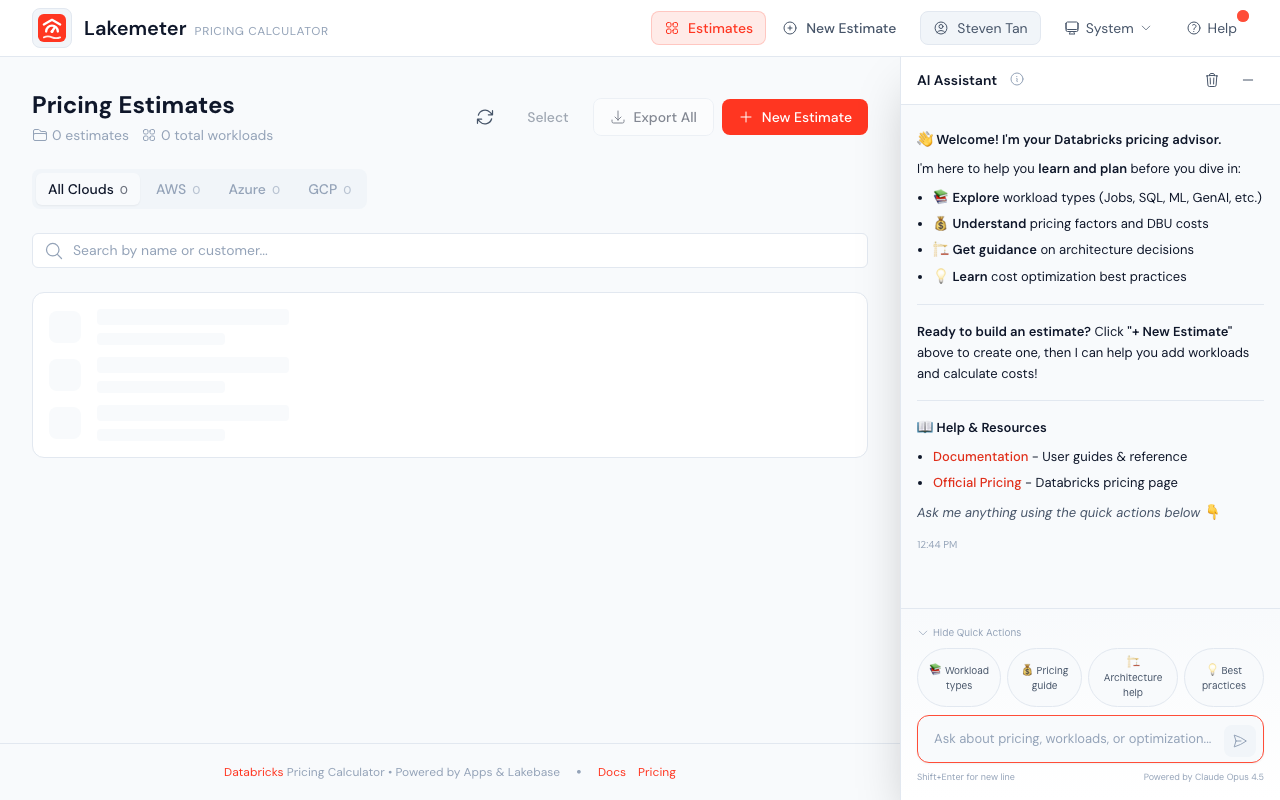 Start from the Lakemeter home page — click New Estimate to begin building a cost estimate.
1. Plan your estimate
Before opening Lakemeter, decide:
- Cloud provider -- the deployment context to model
- Region -- the region used for pricing lookup
- Pricing tier -- the tier used for SKU availability and pricing lookup
Use the options shown in Lakemeter. For current product availability and tier guidance, refer to the official Databricks documentation.
Once you add workloads to an estimate, you cannot change its cloud provider. Choose carefully, or create separate estimates for multi-cloud comparisons.
2. Create the estimate
- Click New Estimate from the home page.
- Enter a descriptive name (e.g., "Acme Corp - AWS us-east-1 Premium").
- Select your cloud, region, and tier.
- Click Create.
You are taken to the Calculator page.
3. Add and configure workloads
Click Add Workload for each Databricks service in your architecture. For each workload:
- Choose the workload type. Use the Workload Sizing Guides if you are unsure which form matches the consumption being estimated.
- Name it descriptively. Use names like "Nightly ETL Pipeline" or "Analyst SQL Warehouse" -- not "Workload 1".
- Configure capacity. Enter the compute shape, service size, endpoint capacity, database range, or other capacity requested by the form.
- Set usage. Enter representative runs, runtime, active hours, tokens, items, or storage in the units shown.
- Review pricing inputs. Confirm the mode, SKU, infrastructure assumptions, and any discount used for planning.
- Add notes (optional). Use the notes field to document why you chose a particular configuration -- useful when reviewing the estimate later or sharing with others.
Costs update in real-time as you adjust parameters.
Use the AI Assistant to speed up configuration. Open the chat panel and describe the workload you want to size. The assistant proposes a supported configuration you can accept, modify, or reject.
4. Review the cost breakdown
The Calculator page displays:
- Per-workload costs -- Monthly DBU, DSU, and VM infrastructure costs where applicable.
- Platform Add-on -- Estimate-level uplift on DBU and DSU Product Spend at List, excluding VM cost.
- Total estimate -- Workloads after discounts plus the selected Platform Add-on.
- DBU and DSU consumption -- Monthly Databricks compute and storage units.
Understanding the cost components:
| Component | What to verify |
|---|---|
| DBU cost | Monthly DBU quantity, selected SKU, and list rate |
| DSU cost | Monthly DSU quantity, component multiplier, and regional DATABRICKS_STORAGE rate |
| VM cost | Instance choice, scale-out count, purchasing assumption, and active hours |
| Quantity-based cost | Token, page, image, or other monthly billing quantity |
| Platform Add-on | Product Spend at List, eligibility, active uplift, promotion, and separate add-on discount |
| Grand total | Workloads after discounts plus the add-on after discount |
Use each workload's sizing guide for its calculation details. See Platform Add-ons for estimate-level uplift behavior. Use the official Databricks documentation for product optimization guidance.
5. Export to Excel
- Click the Excel button (download icon) at the top of the Calculator page.
- The file downloads as
Databricks_Estimate_{name}_{date}.xlsx.
You can also export all your estimates at once from the home page using the bulk export option.
6. Interpret the Excel report
The exported spreadsheet contains several sections:
Header
The estimate name, cloud provider, region, pricing tier, status, version, and timestamps.
Workload table
Each workload produces a primary row with its configuration, billing quantity, rate, and calculated cost. Workloads with separately priced components can add sub-rows.
See Exporting to Excel for the current column groups and multi-row behavior.
Summary and assumptions
Below the workload table, the workbook presents the generated cost summaries, legend, and pricing assumptions. Use the Exporting guide for the current section layout rather than relying on a duplicated column or section list here.
How to use the report
| Use case | What to focus on |
|---|---|
| Customer proposal / RFP | Total cost, workload table, assumptions section |
| Internal budget planning | Total cost, DBU breakdown for chargeback allocation |
| Vendor comparison | Duplicate the estimate for each cloud/region, export both, compare total costs |
| Architecture review | Workload table configuration details, notes column |
7. Iterate and refine
Estimates are living documents. Common iteration patterns:
- Duplicate the estimate to create a "what-if" scenario (e.g., "What if we use serverless instead of classic?")
- Adjust usage patterns as you learn more about actual workload behavior
- Add workloads as the project scope grows
- Change pricing options to model the impact of reserved capacity commitments
- Re-export after changes to get an updated report
Each save increments the estimate's version number, so you can track how the estimate evolved over time.